Creative Coding with ChatGPT and GitHub Copilot
/
Midjourney image using the prompt: "a 1950s era robot holding a paint brush, standing in front of an unfinished abstract painting that shows a triangle, circle and square dancing, with a faded cityscape of Bauhaus buildings in the background, style of a vector illustration --ar 2:1".
TLDR
- With the recent rapid advancements in transformer-based language models, we have entered a new era of AI assisted coding, with GitHub Copilot and ChatGPT being two prominent tools in a rapidly growing space.
- In this post I share two simple anecdotes of how I used each tool for coding assistance on a recent creative coding project, which demonstrate how these tools can enter into the development workflow, and that sometimes they require a bit of iterative trial and error problem solving.
- I have the sense that anyone in tech who is not incorporating these tools into their workflow is at risk of being severely outpaced by those who are able to adapt.
Large language models for writing code
In the past few years several tools have been developed to utilize the capabilities of large language models (LLMs) to assist with writing code. Most of these are built on the GPT (Generative Pretrained Transformer) models developed at OpenAI. As early as mid-2020 when GPT-3 first became available, people began probing its ability to generate useful code. Two prevalent tools that have emerged are GitHub Copilot, launched in mid-2021, and the general purpose ChatGPT, launched in late 2022.
GitHub Copilot is powered by OpenAI’s Codex model, which is built on the GPT-3 foundational model, with additional training on a large corpus of source code for further fine tuning. It is capable of generating code to complete a text prompt, as well as translating code into a natural language description, and translating code between programming languages. Copilot is available to use via IDE plugins (I’m using the Visual Studio Code plugin), and requires a subscription of roughly $10 per month. It can offer autocompletions as you type, which can include generating the code for entire functions or classes. You can also write a comment directed at it, and it will then help write the code to fullfil the comment (it can also write comments itself). In the example I give below, I ended up writing about 10% of the code, Copilot filled in the rest.
ChatGPT is also descended from GPT-3, but with additional fine tuning, including the use of reinforcement learning from human feedback, and has the notable ability to retain context between turns in a conversation, which can allow the user to steer it in an iterative fashion toward a solution. ChatGPT can do everything Copilot can do (i.e. generate code, describe code in natural language etc), but in addition it has this conversational aspect. I think because of that, both tools can play distinct roles in the development cycle of a project, perhaps relying more heavily on Copilot for the bulk of day-to-day coding, and turning to ChatGPT to get assistance working through more complex problems.
I've only started using ChatGPT and Copilot for coding assistance very recently, so I feel a little late to the party, but based on my experience so far, I'm sold on the idea that these tools are a major force multiplier for both creative and productive output.
Below I share two examples of using each tool for coding assistance on a creative coding side project. Neither example is particularly astonishing, but I think they nicely illustrate how these tools can enter into the development workflow, and that sometimes they require a bit of iterative trial and error problem solving.
Iterating toward a solution with ChatGPT
Lately I've been rekindling my interest in algorithmic and generative art and have been exploring ideas around incorporating the comics medium into abstract art, i.e. conveying a sense of sequential narrative flow with shapes, texture, and color across panels and pages. I'm using p5.js, which is a JavaScript library based on the Processing framework that was designed for creative coding projects. You can see some examples of experiments I've done on Instagram.
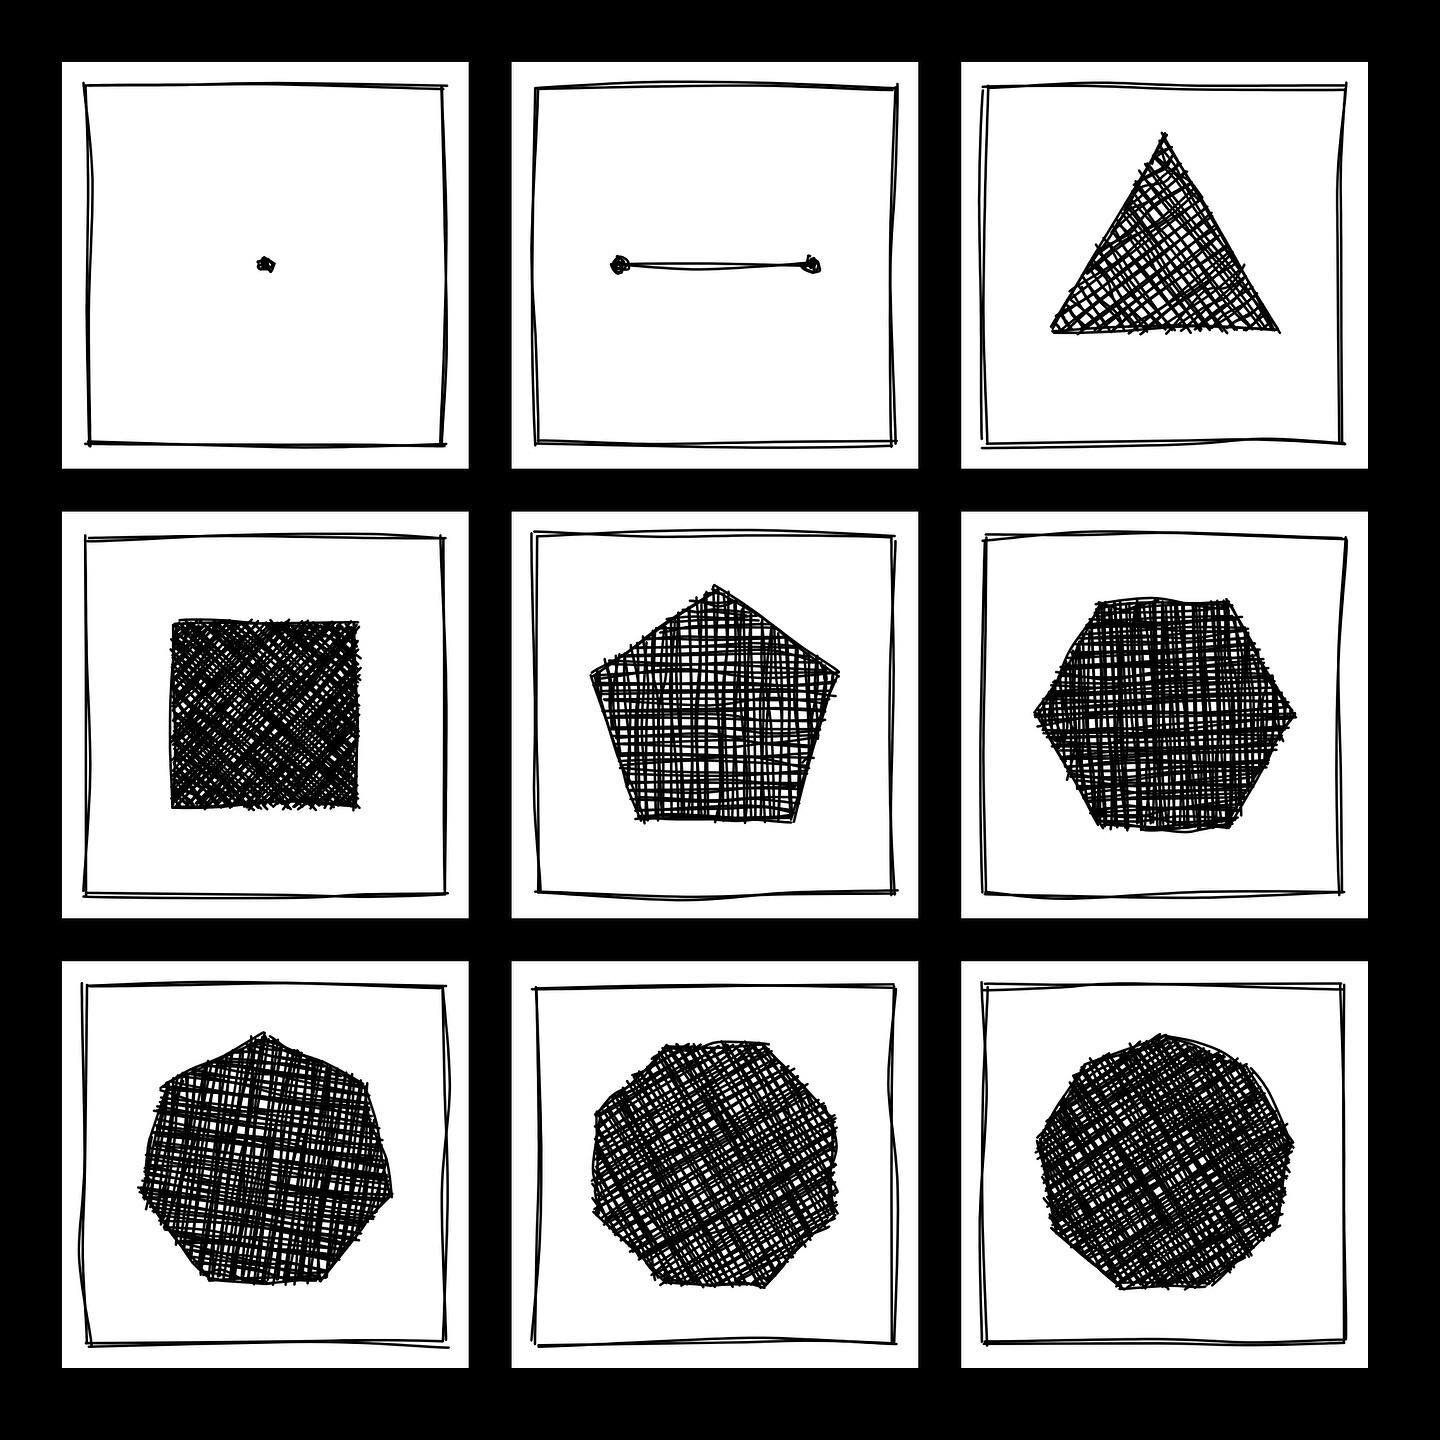
One of my visual experiments required generating regular polygon shapes with n vertices. I started sketching out a solution, but then I got the idea: this would be an excellent test to see how well ChatGPT could generate useful code for a specific and limited problem I needed to solve. I ended up proceeding through a sequence of prompts, iteratively arriving at the result I had in mind.
It's interesting to walk through the chat, but for brevity I'll summarize ChatGPT's responses. For the entire transcript, scroll to the bottom of this post. Fortunately this interaction occurred the day after OpenAI introduced the prompt history feature, which made recalling the chat much easier. My exact prompts are shown in bold. This conversation took place around January 6, 2023.
PROMPT: How do I draw a circle using p5.js? To start things off, I was curious if ChatGPT knew about the p5.js library.
ChatGPT:[This is a summary. See full transcript below.] ChatGPT informed me of the ellipse and circle functions, and showed working examples of how to use them to render images to the web canvas. This was a green light that I might have some success if I continue with my queries.
PROMPT: Could you write p5.js code to draw a regular polygon with input parameters being the number of sides, the position and size? Looking back, it's interesting that I didn't offer up an example function signature, like drawRegularPolygon(position, size, vertexCount) or such. Now that I've clocked some experience using ChatGPT and Copilot, I can imagine Copilot autocompleting given just the function name alone.
ChatGPT: It wrote a function drawRegularPolygon(n, position, size) that utilizes the beginShape / endShape block in p5.js, and computing(x,y) coordinates of n vertices by looping through the rotation angle 2*pi/n, and demonstrating calling the function to draw a triangle. This is a fine solution, but I needed a solution that was compatiable with the scribble.js library I was using to render with a hand-drawn style.
PROMPT: Could you repeat that, but use the scribble.js library and the scribbleLine method? Rather than use the beginShape block, I needed a solution that constructed the shape by calling scribbleLine for each polygon side. I was skeptical that ChatGPT would have enough familiarity with the scribble.js library to produce a valid solution, but I figure I'd try.
ChatGPT: Sure enough, the solution it proposed did not work. This is an example where ChatGPT doesn't know enough to pull together a valid response but still gives an answer with confidence (aka bullshitting). This behavior will improve over time, for example, it could respond with: "I am not familiar with that library. Could you point me to the documentation or source code for it?". Or at the very least be able to qualify a resonse with a likelihood.
PROMPT: That actually wasn't what I wanted, I don't think it will work. Let's back up a step. Could you write the code using the built-in p5.js line method? If I could get ChatGPT to use the p5.js line function, then I figured it would be easy to translate it to the scribble.js API.
ChatGPT: Here, it gives a working solution, drawing the shape using the line function. Although the very first solution it came up with above using the beginShape block was more elegant, this alternate solution is one I could then easily translate into the scribble.js API (by calling the scribbleLine function).
PROMPT: That works well, but suppose I want one side of the polygon to be parallel with the horizon, could I add an angle offset to achieve that? While testing the above solution, I found that for some values of n, I didn't like the orientation of the polygon: I wanted the bottom side to always be parallel to the x-axis. To me, this is starting to get a bit nuanced, and I was skeptical that ChatGPT would be able to provide a valid solution (I assumed I'd get more bullshitting).
ChatGPT: The solution it gave for the angle offset worked for some cases, but was not general for arbitrary n.
PROMPT: What is the formula for the angleOffset so that I can generalize the code to any polygon of n sides?
ChatGPT: It provided an angle offset that worked for odd values of n.
PROMPT: Ok, I tried that result and it only works when n is odd. What should the angleOffset be when n is even?
ChatGPT: It then gave the solution for even values of n, which finally satisified the requirements I had in mind.
This was my first encounter using ChatGPT for coding assitance, and I became an instant convert. I think this exchange nicely illustrates that one can arrive at a useful solution, but it may require several iterations of trial and error while providing feedback and reframing the task to match the constraints for your particular problem.
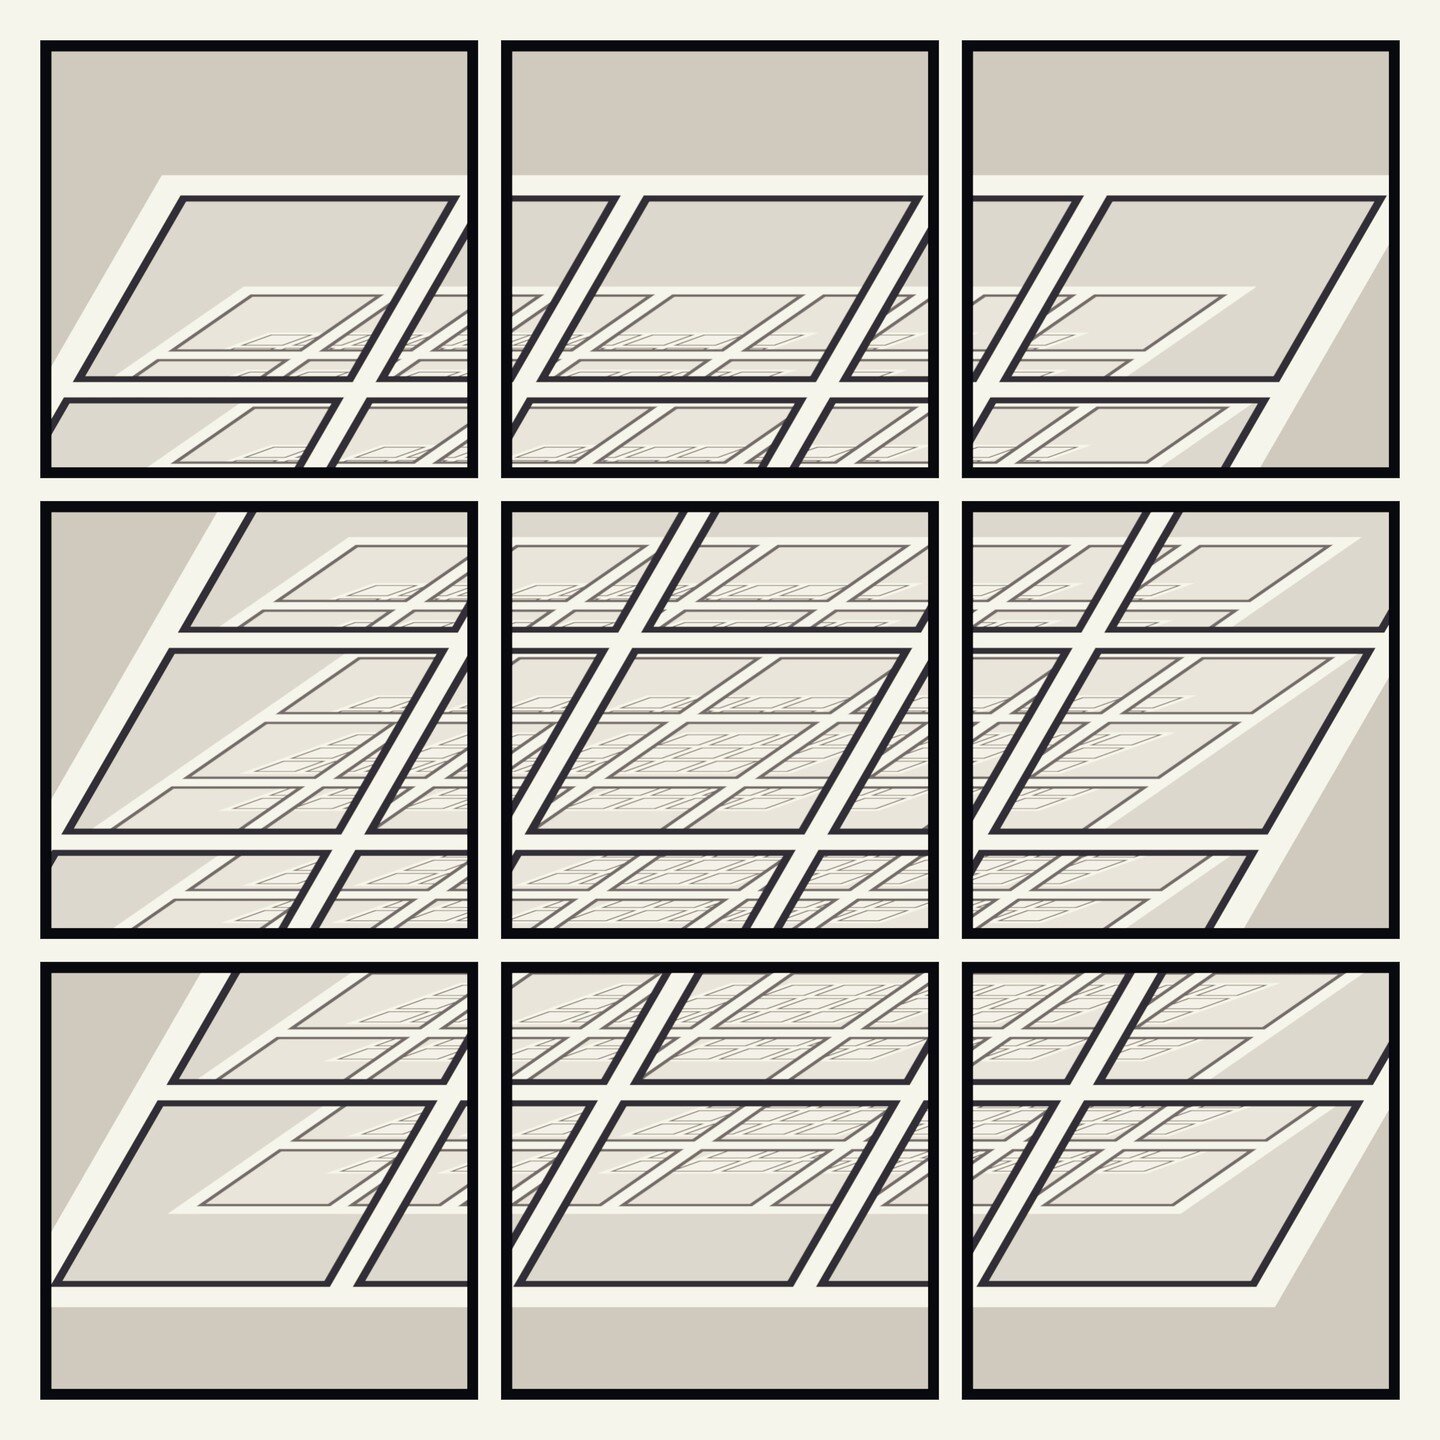
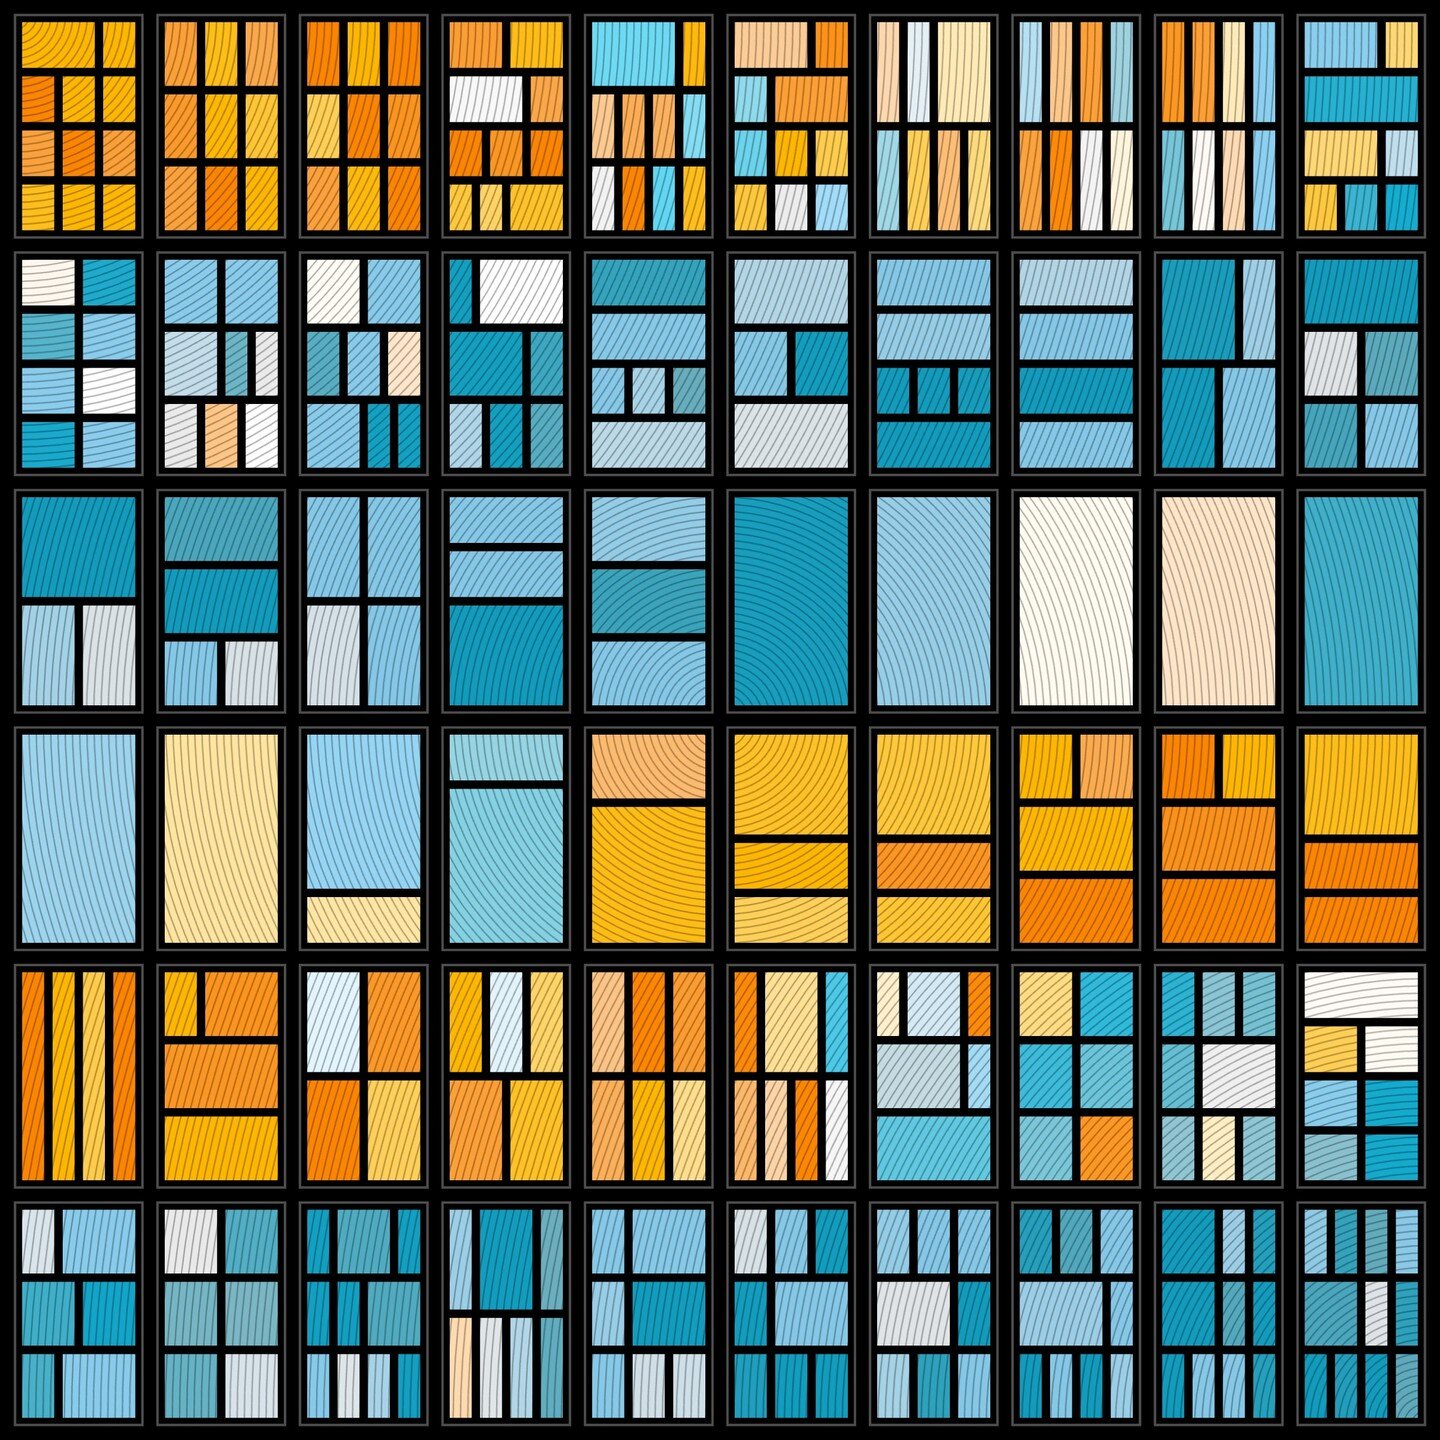
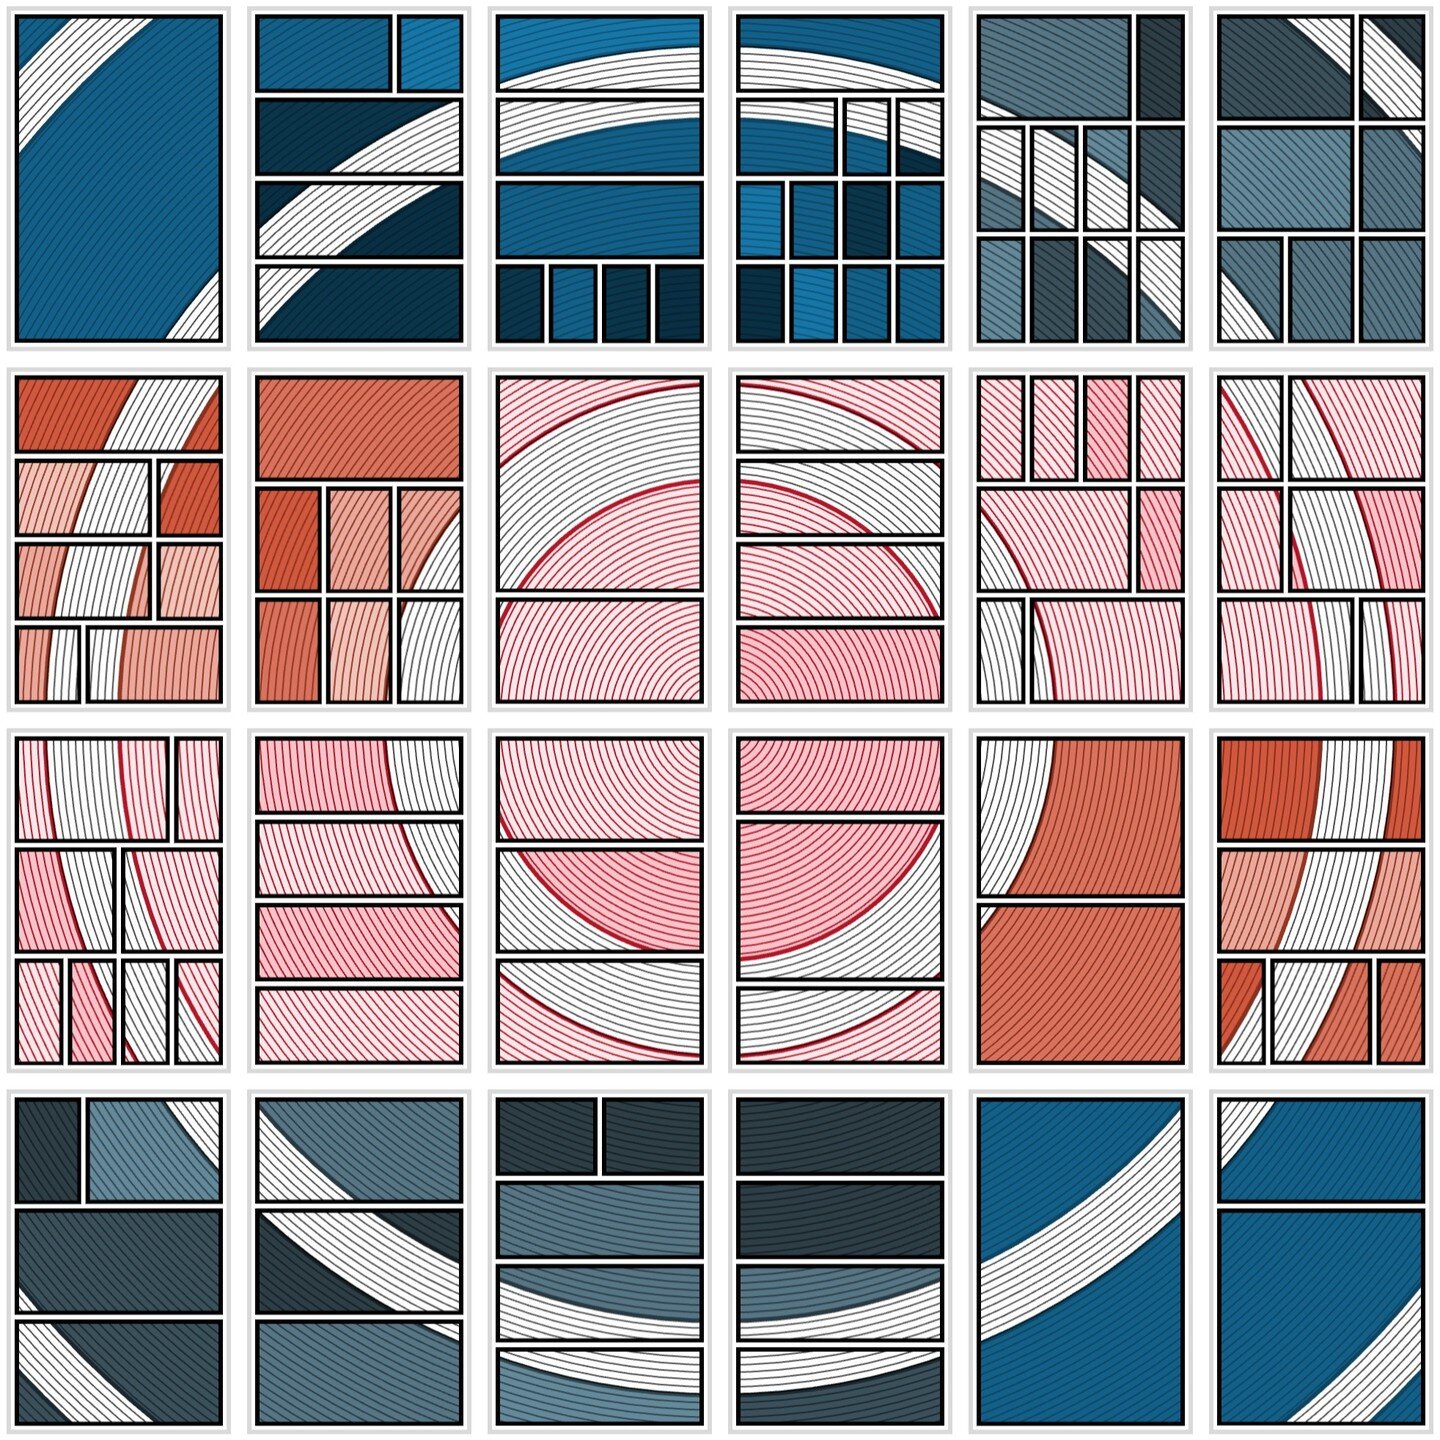
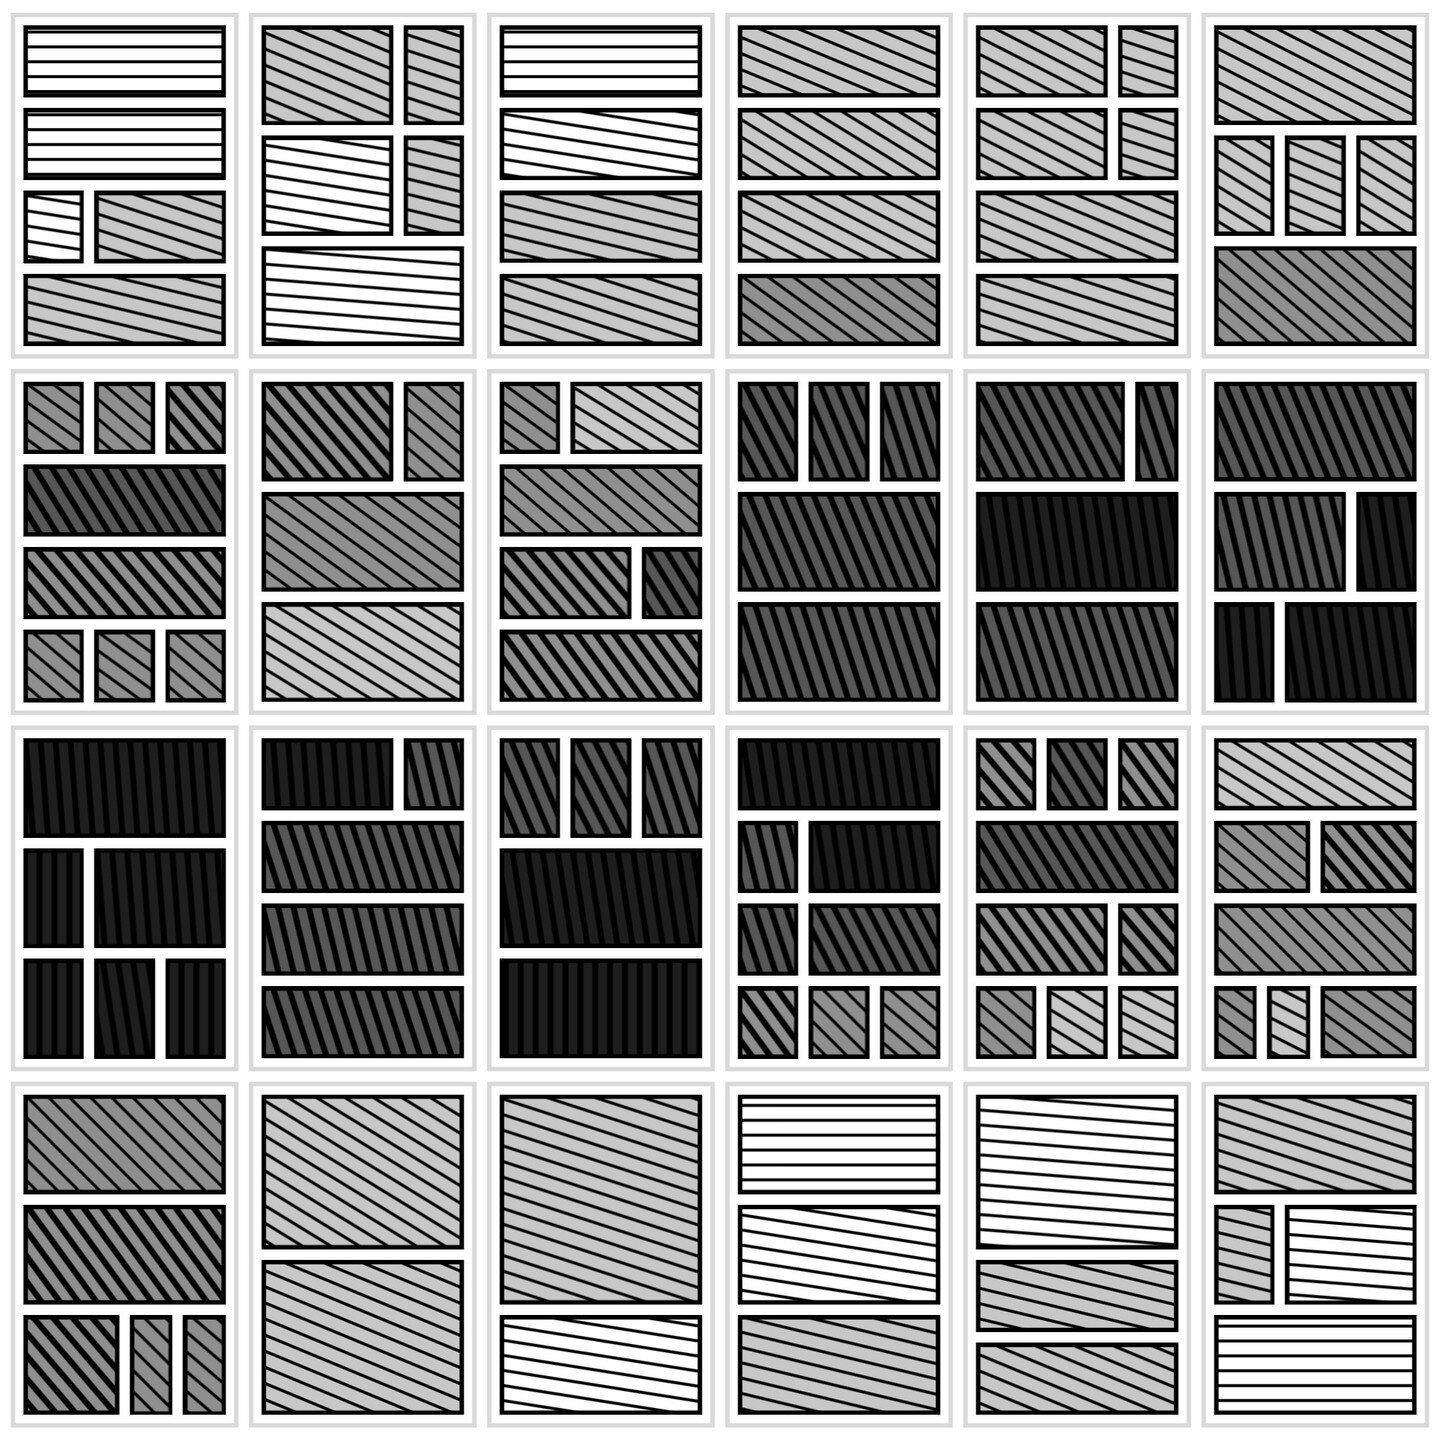
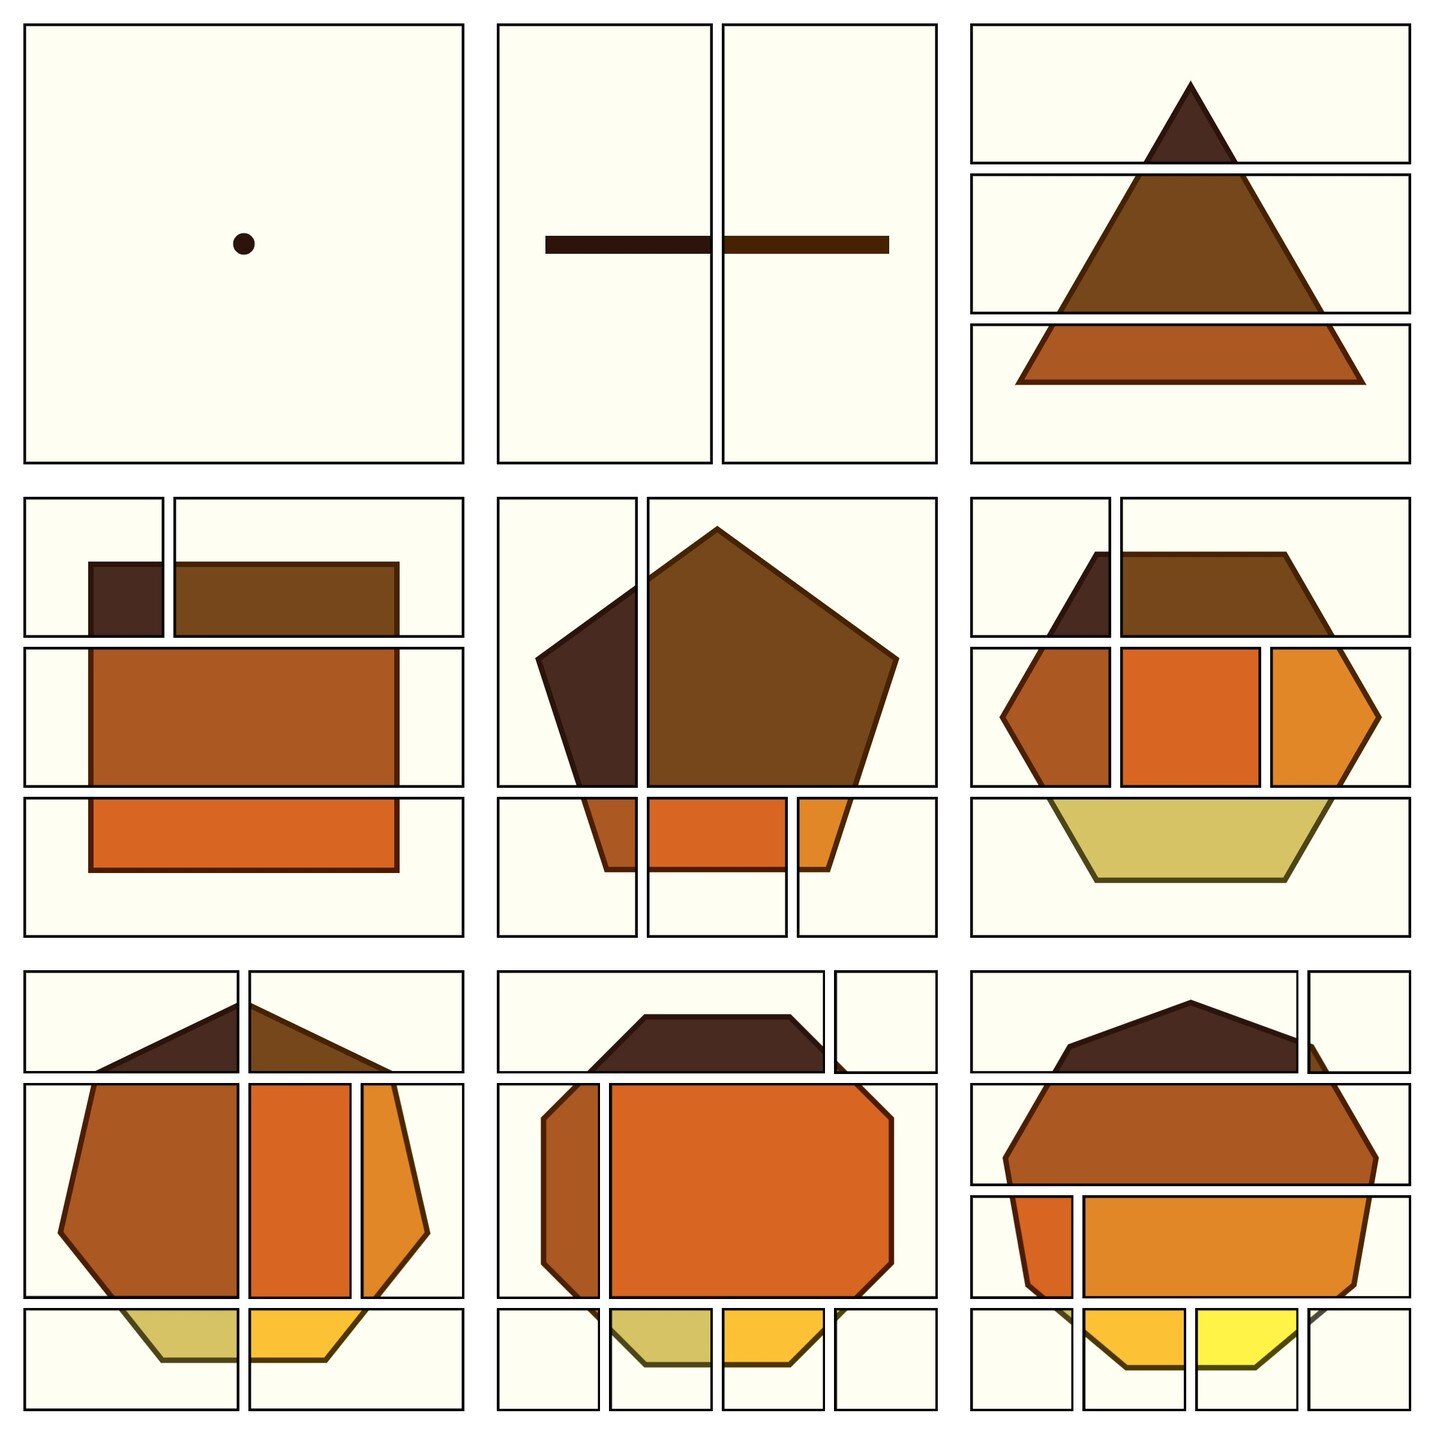
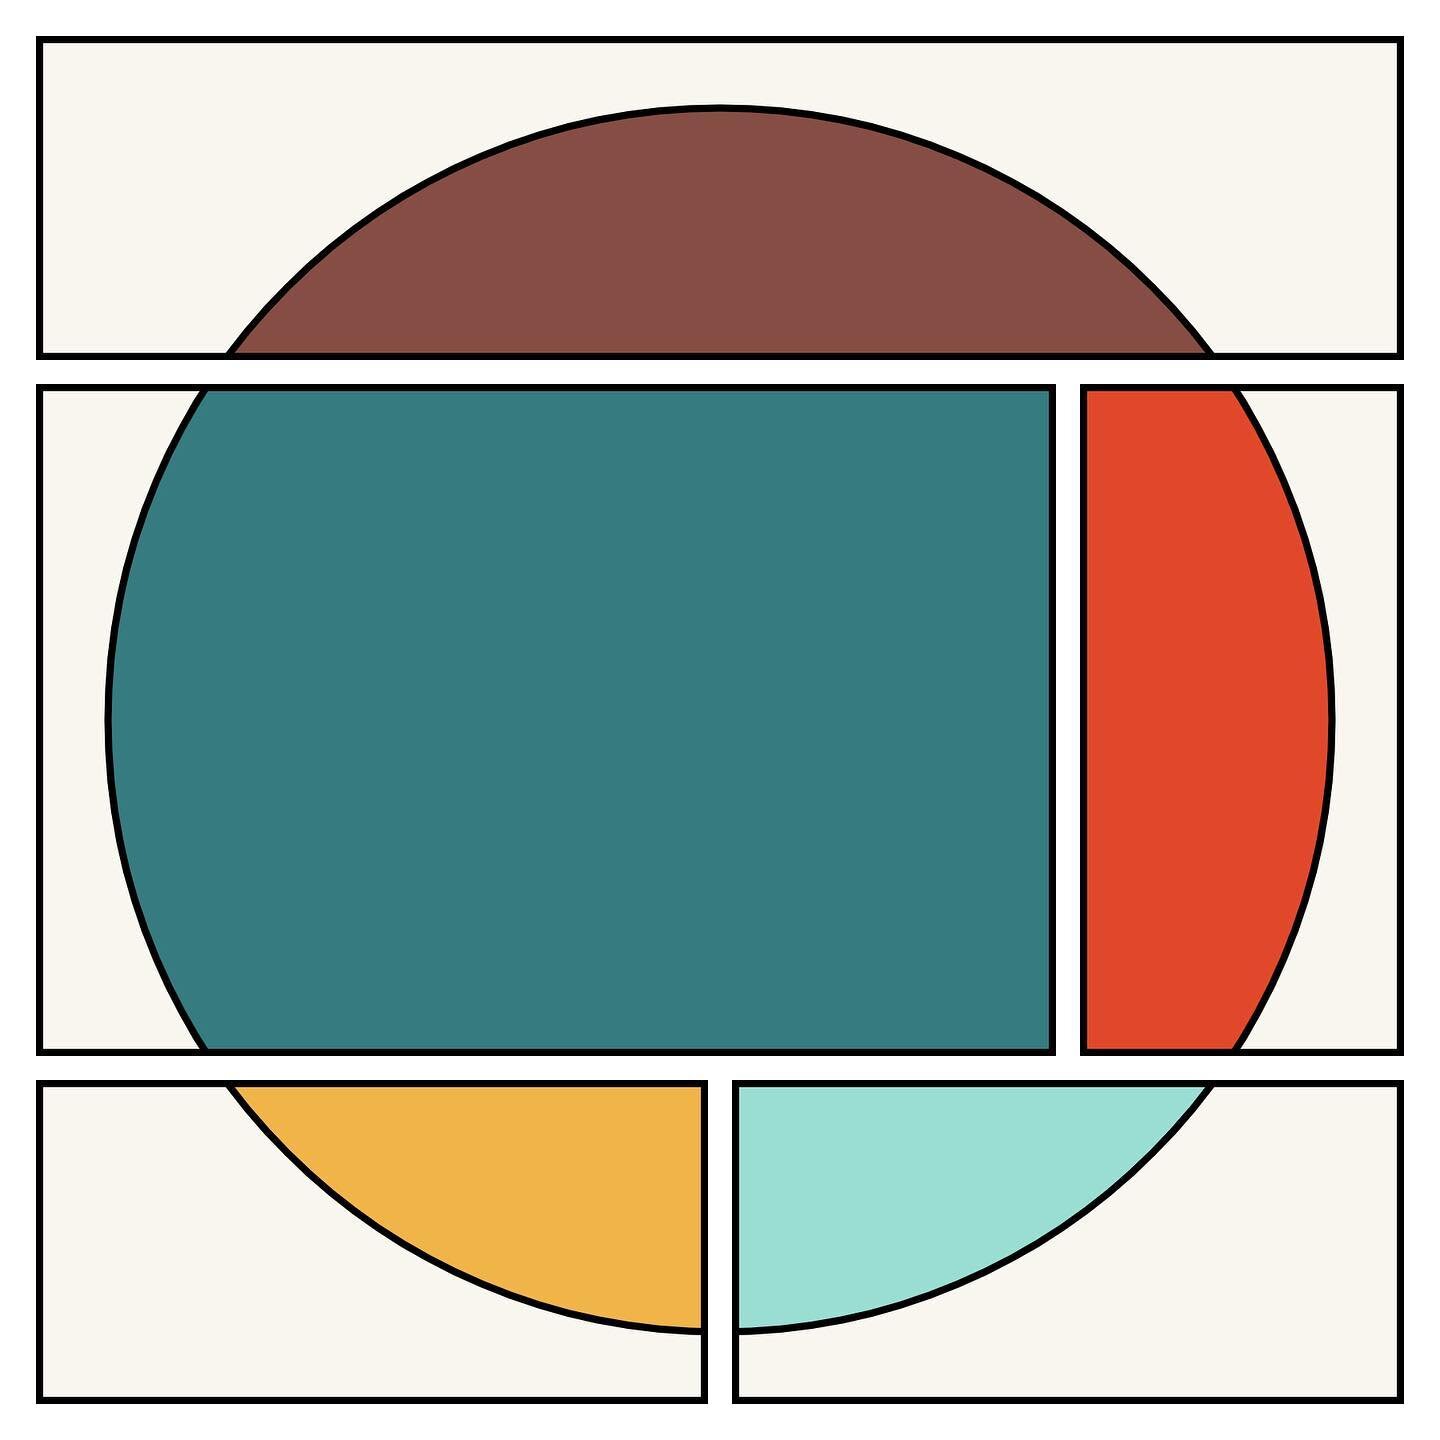
Here is the final output posted to Instagram that utilizes the polygon code that ChatGPT assisted in writing.
GitHub Copilot can read your mind (sometimes)
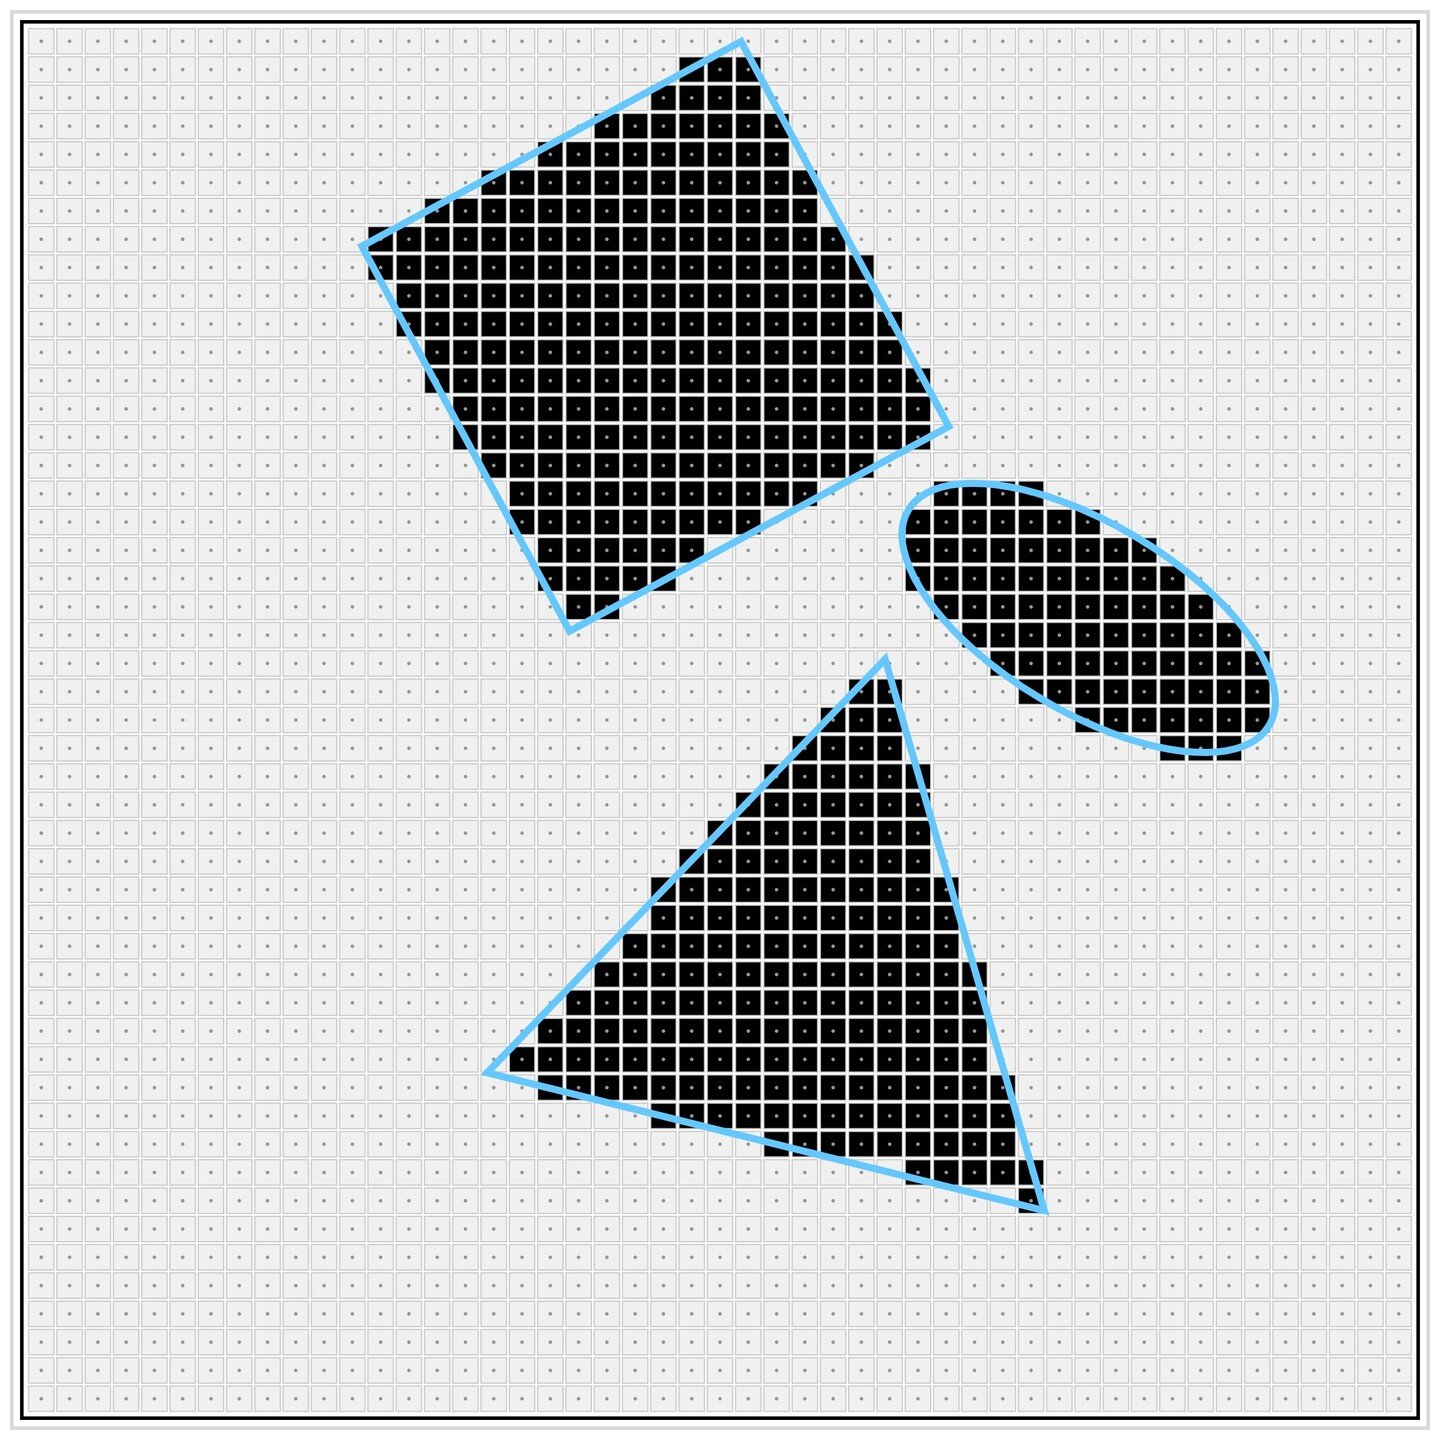
I'll also share my earliest experience using GitHub Copilot, which I started using only very recently. I installed the VS Code plugin and began working on a different p5.js experiment, playing around with shape primitives like an ellipse or rectangle and projecting them onto a grid to build composite shapes. I decided to define shape classes that could encapsulate the methods I needed, like a containsPoint method (i.e. does a point lie within the shape) and a draw method.
ShapeEllipse
I started typing class ShapeEllipse and Copilot offered to autocomplete the constructor, but the signature wasn't exactly what I had in mind, so I typed my own signature, and then Copilot filled in the property boilerplate.
class ShapeEllipse {
    constructor(centerPosition, width, height, rotationAngle=0) {
        this.centerPosition = centerPosition;
        this.width = width;
        this.height = height;
        this.rotationAngle = rotationAngle;
    }
  ...
}
I then moved to the containsPoint method, for which I had already tracked down a solution on StackOverflow. However, in hindsight, I'm confident that Copilot would have been able to autocomplete with a working solution as well. Note that while typing this in, Copilot successfully autocompleted the yterm based on the xterm pattern I had already typed.
containsPoint(p) {
        let xterm = ((Math.cos(this.rotationAngle)*(p.x - this.centerPosition.x) + Math.sin(this.rotationAngle)*(p.y - this.centerPosition.y))**2) / (this.width/2)**2;
        let yterm = ((Math.sin(this.rotationAngle)*(p.x - this.centerPosition.x) - Math.cos(this.rotationAngle)*(p.y - this.centerPosition.y))**2) / (this.height/2)**2;
        return (xterm + yterm) <= 1;
    }
Copilot then offered to write a draw method before I had a chance to type it. By default, Copilot was drawing to the base canvas, but I needed to pass in a graphics object, so I corrected the signature accordingly, and then Copilot adapted the solution to match. That is, it filled in everything in the method body:
draw(graphics) {
        graphics.push();
        graphics.translate(this.centerPosition.x, this.centerPosition.y);
        graphics.rotate(this.rotationAngle);
        graphics.ellipse(0, 0, this.width, this.height);
        graphics.pop();
    }
This completed the ShapeEllipse class (or at least, what I needed at that stage).
ShapeRectangle
I then started typing class ShapeRectangle and Copilot autocompleted the entire class, and nailed it on the first try:
class ShapeRectangle {
    constructor(centerPosition, width, height, rotationAngle=0) {
        this.centerPosition = centerPosition;
        this.width = width;
        this.height = height;
        this.rotationAngle = rotationAngle;
    }

    containsPoint(p) {
        let xterm = Math.abs(Math.cos(this.rotationAngle)*(p.x - this.centerPosition.x) + Math.sin(this.rotationAngle)*(p.y - this.centerPosition.y));
        let yterm = Math.abs(Math.sin(this.rotationAngle)*(p.x - this.centerPosition.x) - Math.cos(this.rotationAngle)*(p.y - this.centerPosition.y));
        return (xterm <= this.width/2) && (yterm <= this.height/2);
    }

    draw(graphics) {
        graphics.push();
        graphics.translate(this.centerPosition.x, this.centerPosition.y);
        graphics.rotate(this.rotationAngle);
        graphics.rectMode(CENTER);
        graphics.rect(0, 0, this.width, this.height);
        graphics.pop();
    }
}
So far, out of roughly forty lines of code, I only had to type four or five lines!
ShapeRegularPolygon & ShapePolygon
I started typing class Shape and Copilot autocompleted to class ShapePolygon, which is interesting. But I actually wanted to first handle regular polygons before moving on to more general polygons. So, I typed class ShapeRegularPolygon, and Copilot autocompleted the constructor, containsPoint, and draw methods.
However, this is where I hit a snag: the containsPoint method didn't work properly (the draw method worked fine). After a few failed attempts with Copilot, I then turned to ChatGPT to construct the containsPoint method, but it essentially generated the same broken code. However, while interacting with ChatGPT, it revealed it was trying to implement the ray casting algorithm to determine if a point lies within a polygon. For some reason, it couldn't properly apply the algorithm in the case of a regular polygon. However, when I shifted to writing the more general polygon class, I found that both ChatGPT and Copilot correctly implemented the containsPoint method using the ray casting algorithm:
class ShapePolygon {
    constructor(vertices) {
        this.vertices = vertices;
    }

    containsPoint(p) {
      let intersections = 0;
      for (let i = 0; i < this.vertices.length; i++) {
          let v1 = this.vertices[i];
          let v2 = this.vertices[(i+1) % this.vertices.length];
          if (v1.y > p.y != v2.y > p.y) {
              let x = (p.y - v1.y) * (v2.x - v1.x) / (v2.y - v1.y) + v1.x;
              if (x > p.x) {
                  intersections++;
              }
          }
      }
      return intersections % 2 == 1;
    }

    draw(graphics) {
        graphics.beginShape();
        for (let i = 0; i < this.vertices.length; i++) {
            graphics.vertex(this.vertices[i].x, this.vertices[i].y);
        }
        graphics.endShape(CLOSE);
    }
}
Once I had this result, I could easily see a path toward a solution for ShapeRegularPolygon: I just needed to provide the vertex coordinates, and then I could reuse the same containsPoint method used for ShapePolygon. So, I added a getVertices method to the ShapeRegularPolygon class, which Copilot filled in for me. With that method in place, Copilot was able to generate a working version of the containsPoint method, making use of the getVertices method. For some reason, neither Copilot or ChatGPT was able to carry out this abstraction on its own when I initially tried writing the ShapeRegularPolygon class, but once I provided this intervention, it succeeded.
class ShapeRegularPolygon {
    constructor(centerPosition, radius, numSides, rotationAngle=0) {
        this.centerPosition = centerPosition;
        this.radius = radius;
        this.numSides = numSides;
        this.rotationAngle = rotationAngle;
    }

    getVertices() {
        let vertices = [];
        for (let i = 0; i < this.numSides; i++) {
            let angle = this.rotationAngle + i * 2 * Math.PI / this.numSides;
            let x = this.centerPosition.x + this.radius * Math.cos(angle);
            let y = this.centerPosition.y + this.radius * Math.sin(angle);
            vertices.push({x: x, y: y});
        }
        return vertices;
    }

    containsPoint(p) {
      let intersections = 0;
      let vertices = this.getVertices();
      for (let i = 0; i < vertices.length; i++) {
          let v1 = vertices[i];
          let v2 = vertices[(i+1) % vertices.length];
          if (v1.y > p.y != v2.y > p.y) {
              let x = (p.y - v1.y) * (v2.x - v1.x) / (v2.y - v1.y) + v1.x;
              if (x > p.x) {
                  intersections++;
              }
          }
      }
      return intersections % 2 == 1;
    }

    draw(graphics) {
        graphics.push();
        graphics.translate(this.centerPosition.x, this.centerPosition.y);
        graphics.rotate(this.rotationAngle);
        graphics.beginShape();
        for (let i = 0; i < this.numSides; i++) {
            let angle = i * 2 * Math.PI / this.numSides;
            let x = this.radius * Math.cos(angle);
            let y = this.radius * Math.sin(angle);
            graphics.vertex(x, y);
        }
        graphics.endShape(CLOSE);
        graphics.pop();
    }
}
Finally, I'll share that an obvious next step was to do a bit of refactoring to pull the common containsPoint method out of ShapePolygon and ShapeRegularPolygon . I did this by typing a comment in the file. I started typing:
// refactor ShapePolygon and ShapeRegularPolygon to use a shared function called containsPoint(p, vertices)Copilot autocompleted the comment with a second line
// (this will require you to refactor the code in the containsPoint() functions for ShapePolygon and ShapeRegularPolygon)Without giving the details, Copilot made it a snap to do this refactoring.
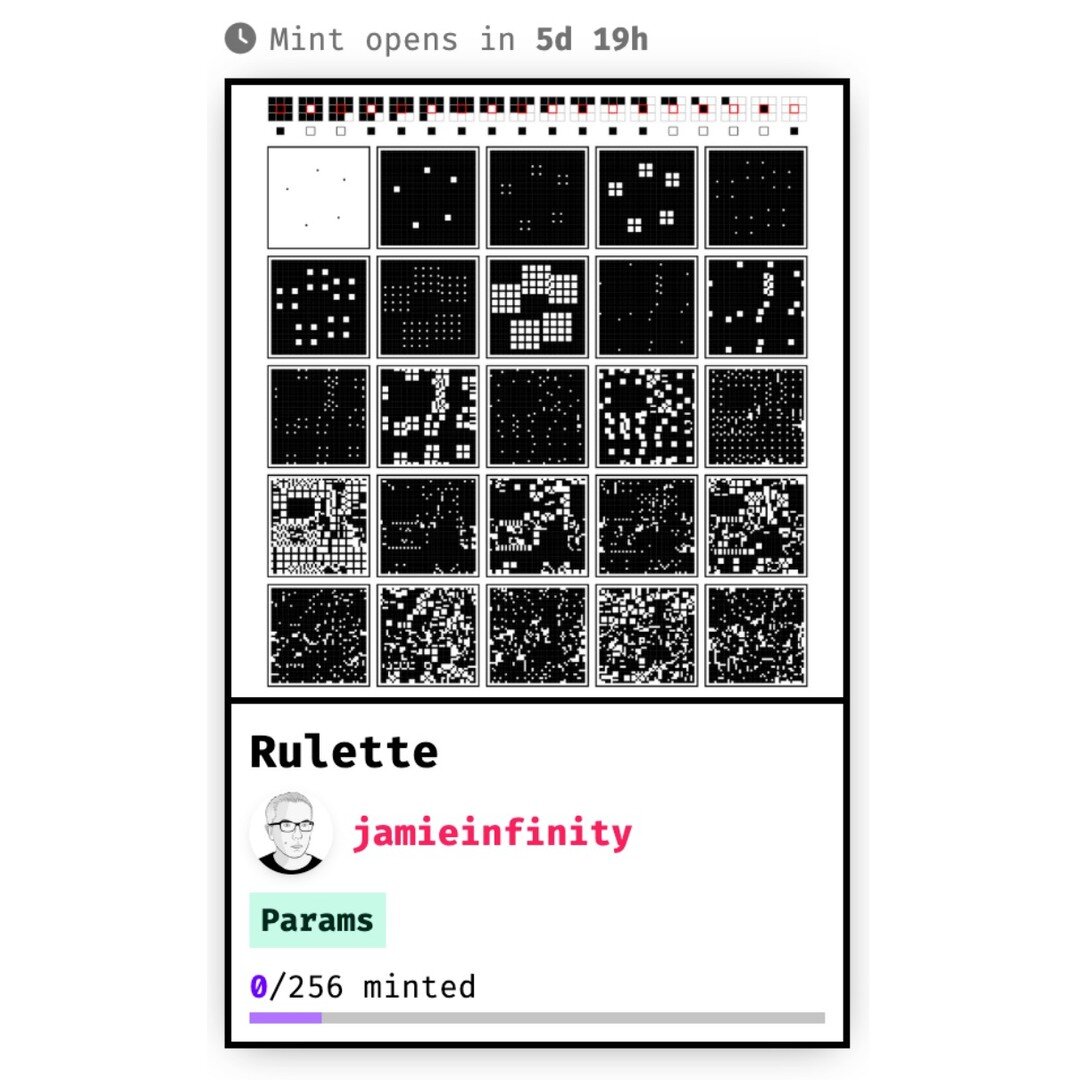
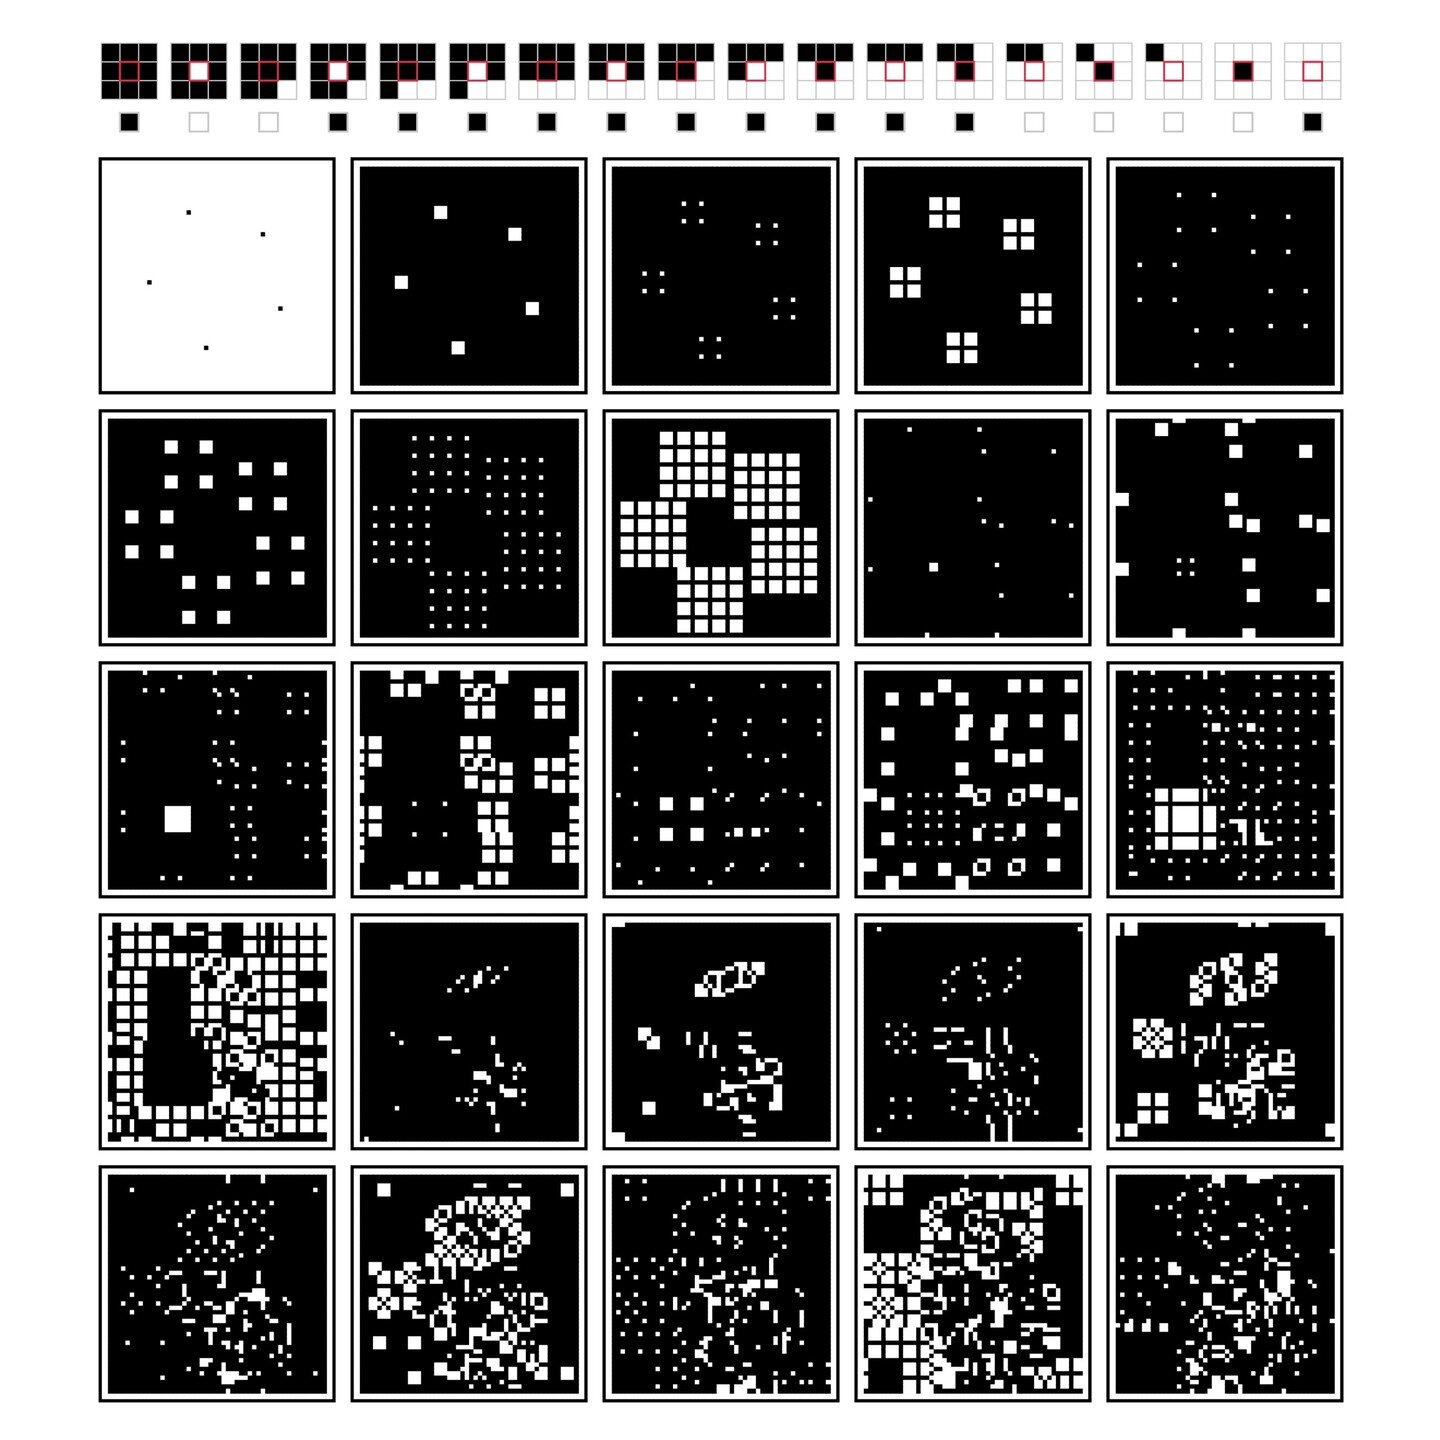
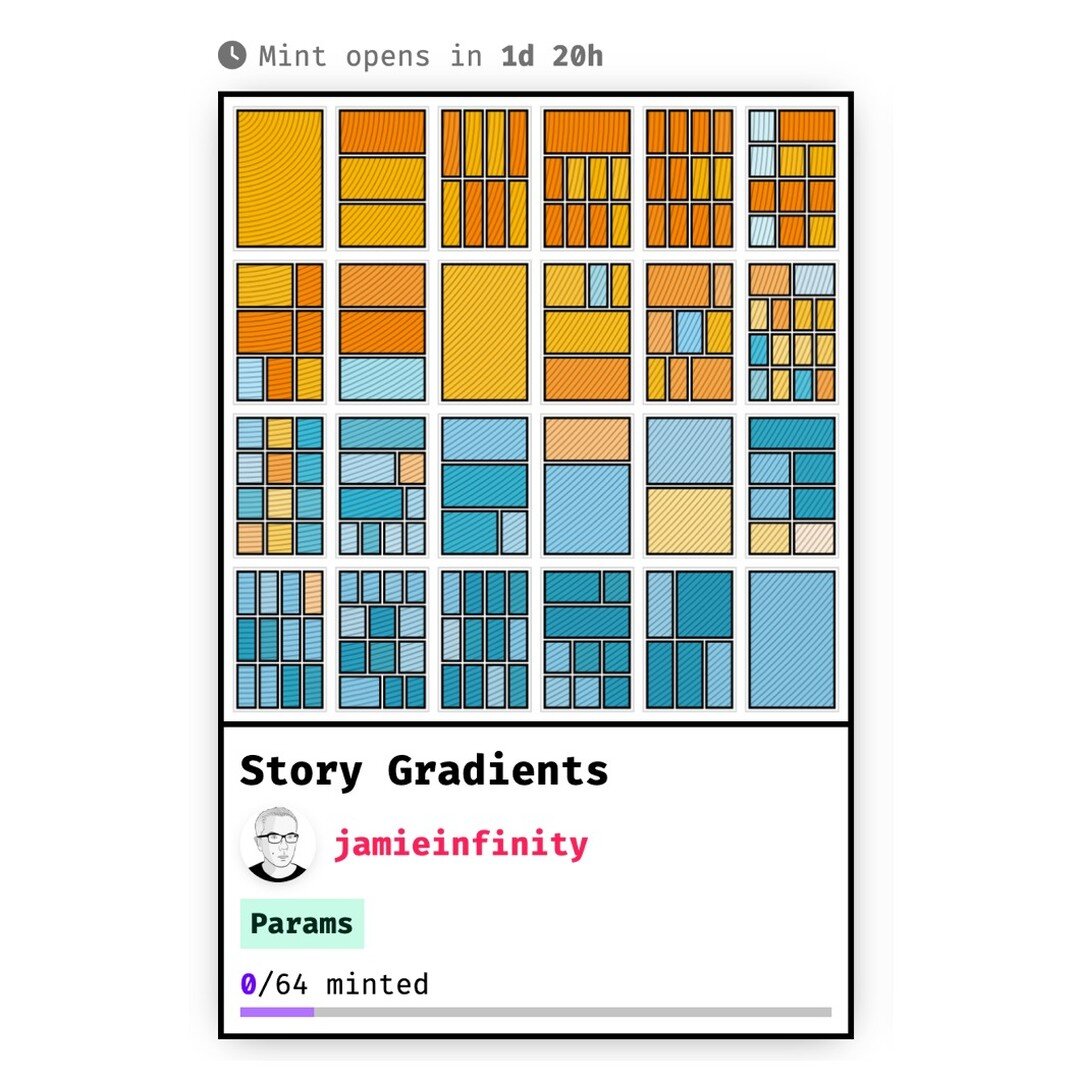
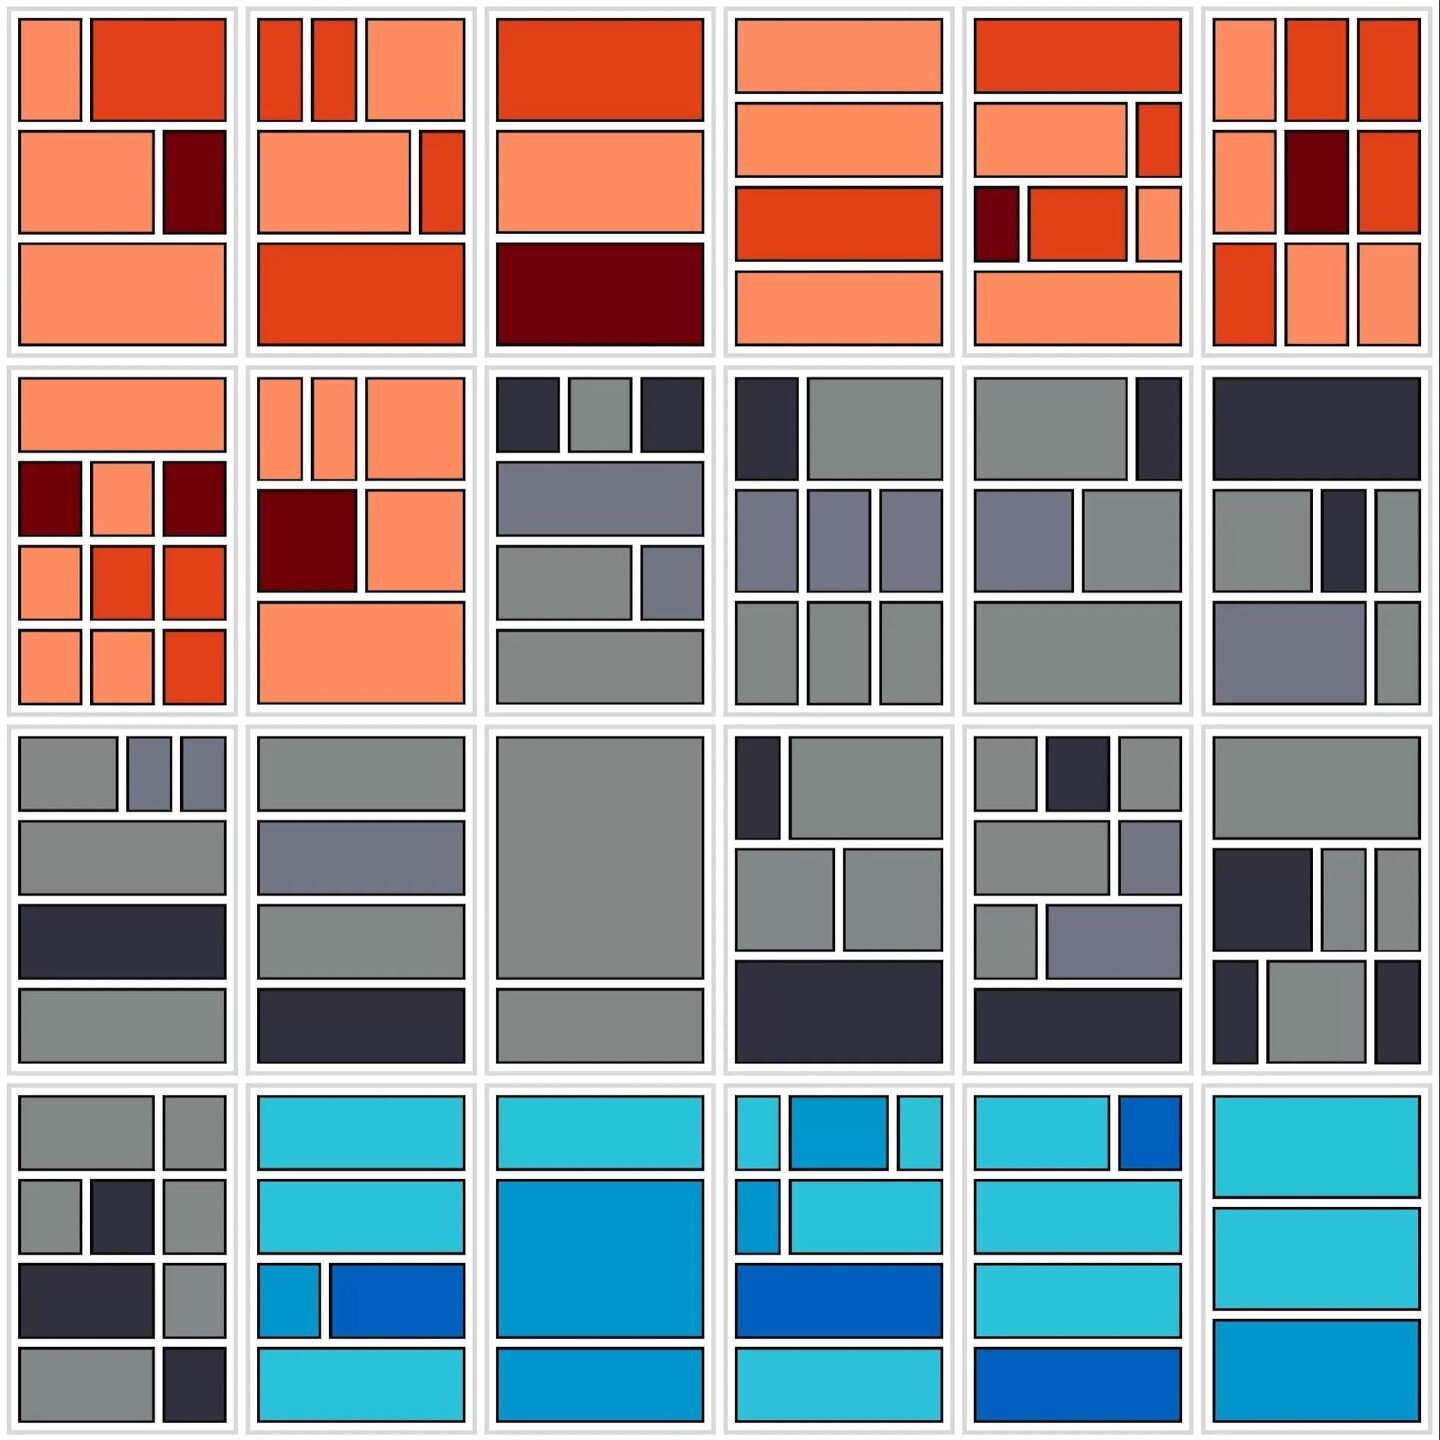
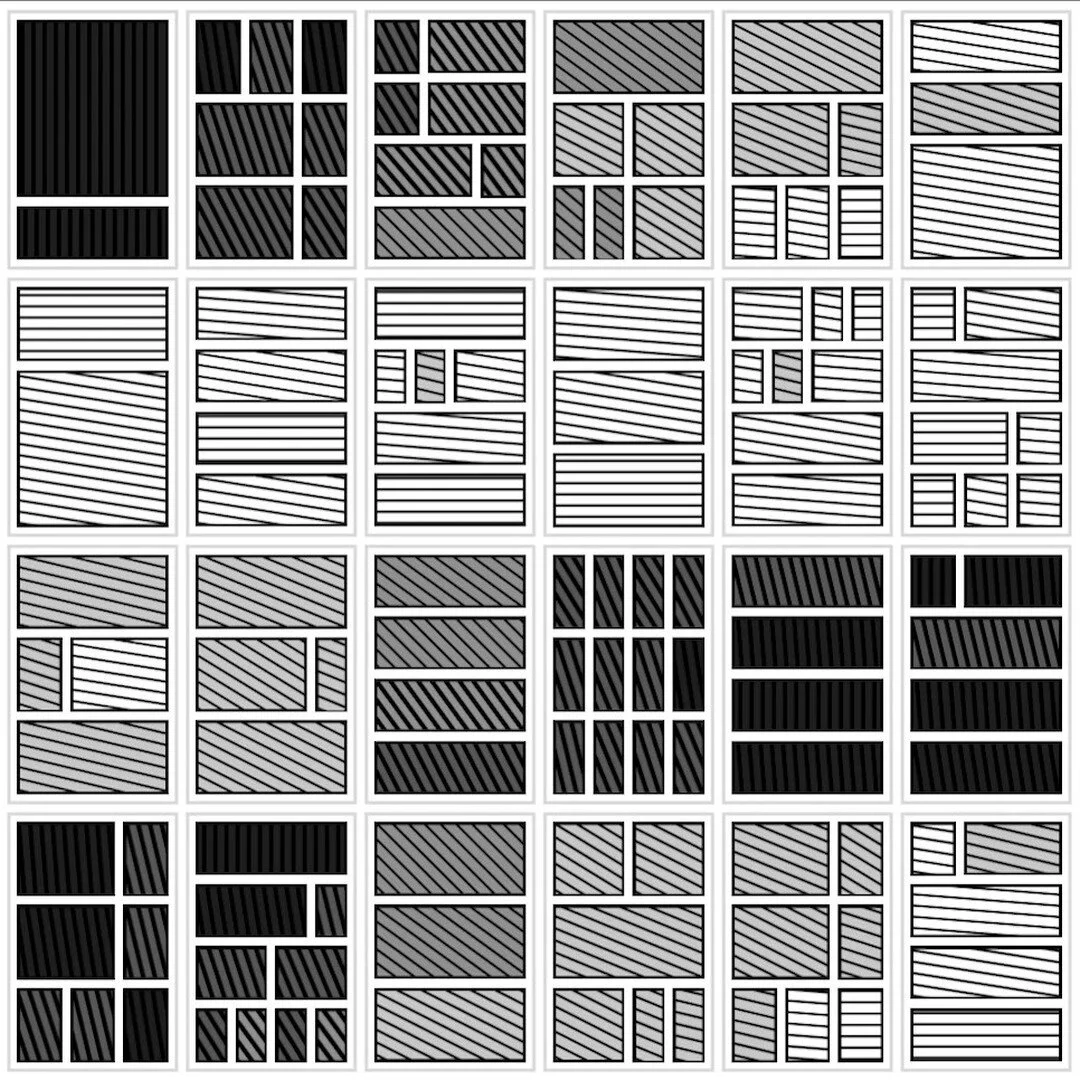
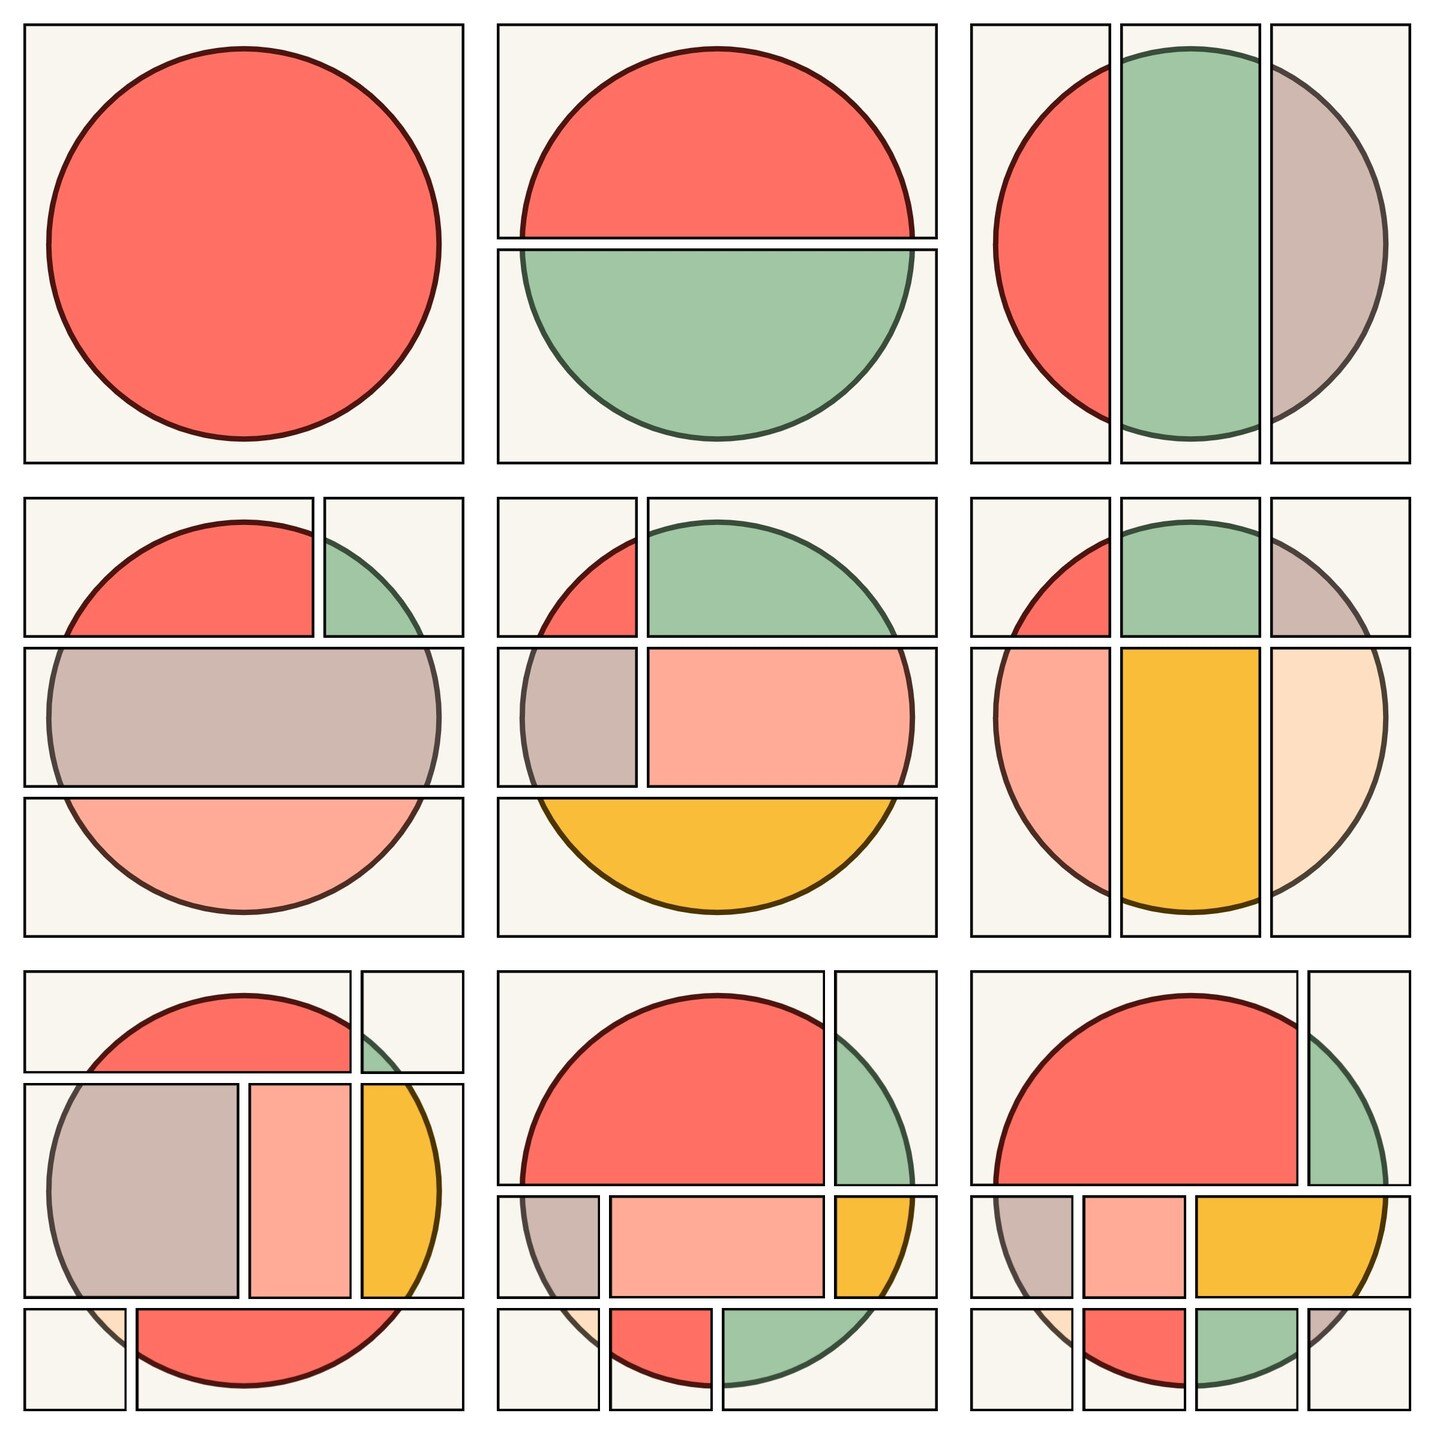
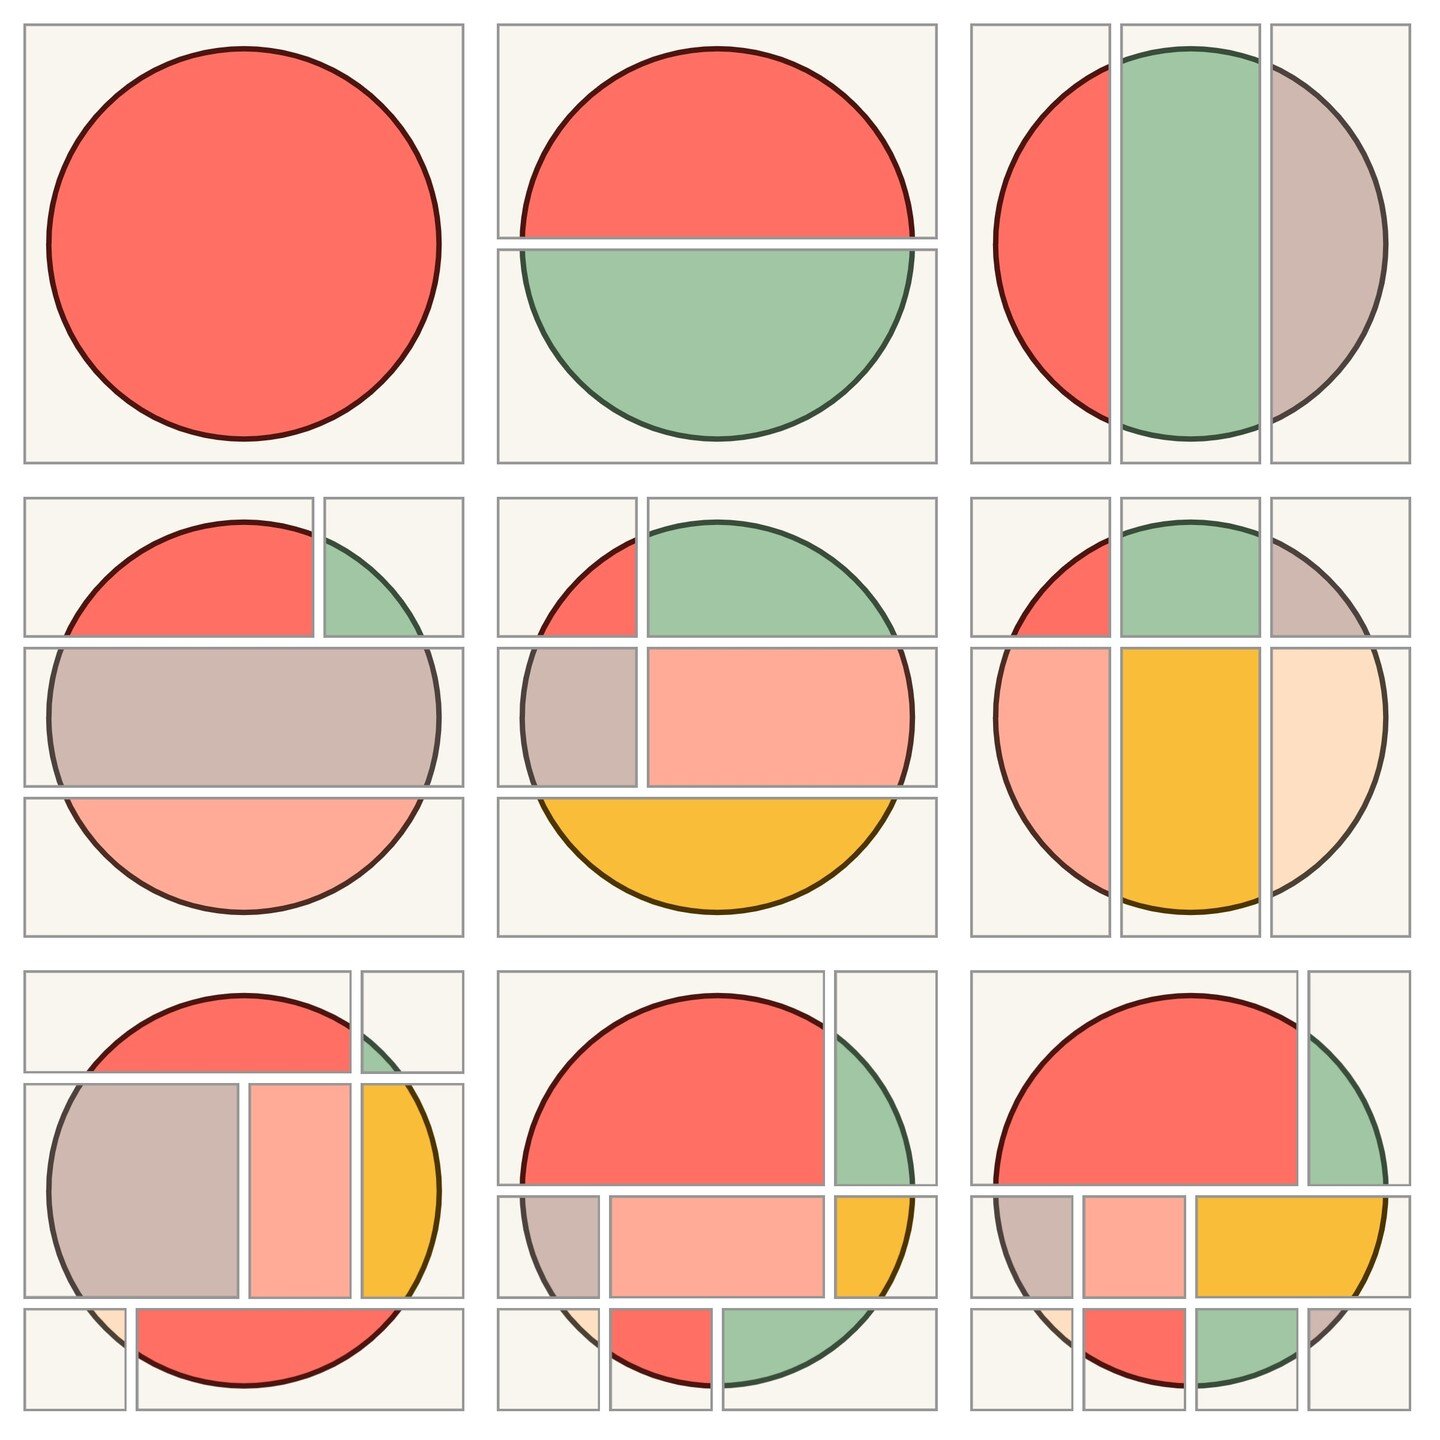
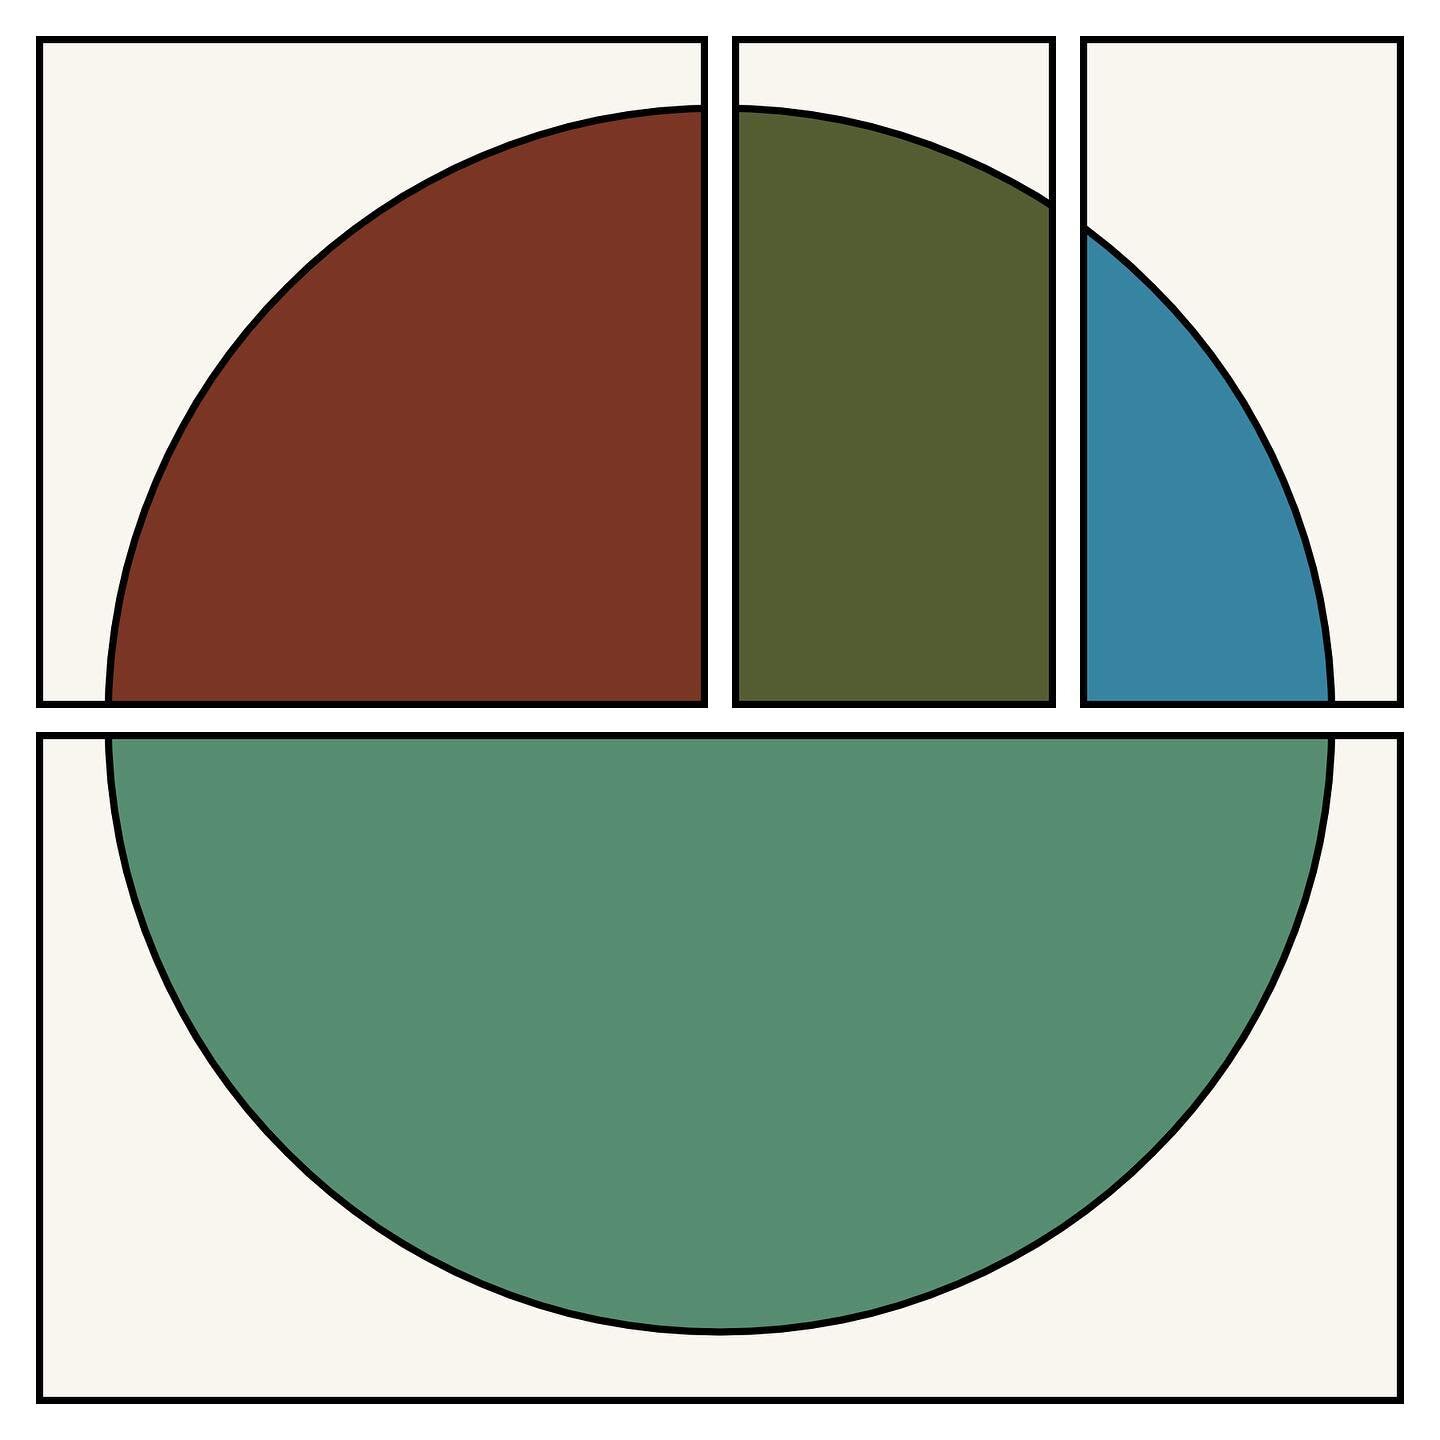
Here is the final output posted to Instagram that utilizes these shape classes and other code that Copilot assisted writing.
Closing thoughts
With the recent rapid advancements in transformer-based language models, we have entered a new era of AI assisted coding. By now one can find many blog posts sharing examples over a broad range of use cases, including data science and analyitcs applications. I've shared two simple anecdotes that give a flavor for how these tools can enhance and accelerate the development process. I have the sense that anyone in tech who is not incorporating these tools into their workflow to boost their effectiveness and productivity is at risk of being severely outpaced by those who are able to adapt. I just hope I can keep up...
Appendix: the full ChatGPT transcript
This chat took place around 1/6/23.
PROMPT: How do I draw a circle using p5.js?
ChatGPT Response:
You can use the ellipse function to draw a circle in p5.js. The ellipse function takes four parameters: the x and y coordinates of the center of the circle, and the width and height of the circle. To draw a circle with a diameter of 50 pixels, for example, you would write:
ellipse(x, y, 50, 50);Here's an example that draws a circle at the center of the canvas with a diameter of 50 pixels:
function setup() {
  createCanvas(400, 400);
}

function draw() {
  background(220);
  ellipse(width/2, height/2, 50, 50);
}
You can also use the circle function to draw a circle. The circle function takes three parameters: the x and y coordinates of the center of the circle, and the diameter of the circle. Here's the same example as above, but using the circle function:
function setup() {
  createCanvas(400, 400);
}

function draw() {
  background(220);
  circle(width/2, height/2, 50);
}
PROMPT: Could you write p5.js code to draw a regular polygon with input parameters being the number of sides, the position and size?
ChatGPT Response:
Sure! Here's a function that takes three parameters: the number of sides of the regular polygon, the position of the center of the polygon, and the size of the polygon. It uses these parameters to draw a regular polygon using the beginShape, vertex, and endShape functions in p5.js:
function drawRegularPolygon(n, position, size) {
  beginShape();
  for (let i = 0; i < n; i++) {
    let angle = TWO_PI / n * i;
    let x = position.x + size * cos(angle);
    let y = position.y + size * sin(angle);
    vertex(x, y);
  }
  endShape(CLOSE);
}
You can use this function by calling it in the draw function and passing in the desired number of sides, position, and size. For example:
function draw() {
  background(220);
  drawRegularPolygon(3, {x: 100, y: 100}, 50);
}
This will draw an equilateral triangle with its center at (100, 100) and a size of 50 pixels.
PROMPT: Could you repeat that, but use the scribble.js library and the scribbleLine method?
ChatGPT Response:
Sure! Here's a revised version of the drawRegularPolygon function that uses the scribbleLine method from the scribble.js library to draw a regular polygon:
function drawRegularPolygon(n, position, size, scribble) {
  beginShape();
  for (let i = 0; i < n; i++) {
    let angle = TWO_PI / n * i;
    let x = position.x + size * cos(angle);
    let y = position.y + size * sin(angle);
    vertex(x, y);
  }
  endShape(CLOSE);
  scribble.scribbleLine(beginShape(), endShape());
}
You can use this function by calling it in the draw function and passing in the desired number of sides, position, size, and a scribble object. For example:
let scribble;

function setup() {
  createCanvas(400, 400);
  scribble = new Scribble();
}

function draw() {
  background(220);
  drawRegularPolygon(3, {x: 100, y: 100}, 50, scribble);
}
This will draw an equilateral triangle with its center at (100, 100) and a size of 50 pixels, using the scribbleLine method from the scribble.js library to give the lines a hand-drawn appearance.
PROMPT: That actually wasn't what I wanted, I don't think it will work. Let's back up a step. Could you write the code using the built-in p5.js line method?
ChatGPT Response:
Sure! Here's a revised version of the drawRegularPolygon function that uses the line method from p5.js to draw a regular polygon:
function drawRegularPolygon(n, position, size) {
  let angle = TWO_PI / n;
  let prevPoint = {
    x: position.x + size * cos(0),
    y: position.y + size * sin(0)
  };
  for (let i = 1; i < n; i++) {
    let currPoint = {
      x: position.x + size * cos(angle * i),
      y: position.y + size * sin(angle * i)
    };
    line(prevPoint.x, prevPoint.y, currPoint.x, currPoint.y);
    prevPoint = currPoint;
  }
  line(prevPoint.x, prevPoint.y, position.x + size * cos(0), position.y + size * sin(0));
}
You can use this function by calling it in the draw function and passing in the desired number of sides, position, and size. For example:
function draw() {
  background(220);
  drawRegularPolygon(3, {x: 100, y: 100}, 50);
}
This will draw an equilateral triangle with its center at (100, 100) and a size of 50 pixels, using the line method from p5.js to draw the lines.
PROMPT: That works well, but suppose I want one side of the polygon to be parallel with the horizon, could I add an angle offset to achieve that?
ChatGPT Response:
Yes, you can add an angle offset to the drawRegularPolygon function to rotate the polygon around its center point. Here's a revised version of the function that takes an additional parameter called angleOffset:
function drawRegularPolygon(n, position, size, angleOffset) {
  let angle = TWO_PI / n;
  let prevPoint = {
    x: position.x + size * cos(angleOffset),
    y: position.y + size * sin(angleOffset)
  };
  for (let i = 1; i < n; i++) {
    let currPoint = {
      x: position.x + size * cos(angle * i + angleOffset),
      y: position.y + size * sin(angle * i + angleOffset)
    };
    line(prevPoint.x, prevPoint.y, currPoint.x, currPoint.y);
    prevPoint = currPoint;
  }
  line(prevPoint.x, prevPoint.y, position.x + size * cos(angleOffset), position.y + size * sin(angleOffset));
}
You can use this function by calling it in the draw function and passing in the desired number of sides, position, size, and angle offset. For example:
function draw() {
  background(220);
  drawRegularPolygon(3, {x: 100, y: 100}, 50, PI / 2);
}
This will draw an equilateral triangle with its center at (100, 100) and a size of 50 pixels, with one side of the triangle parallel to the horizon. The angleOffset parameter is specified as PI / 2, which rotates the triangle 90 degrees counterclockwise around its center point.
PROMPT: What is the formula for the angleOffset so that I can generalize the code to any polygon of n sides?
ChatGPT Response:
To generalize the code to any regular polygon with n sides, you can use the following formula for the angleOffset:
angleOffset = PI / 2 - TWO_PI / n;This will rotate the polygon so that one of its sides is parallel to the horizon. Here's the revised drawRegularPolygon function with the angleOffset formula included:
function drawRegularPolygon(n, position, size) {
  let angle = TWO_PI / n;
  let angleOffset = PI / 2 - TWO_PI / n;
  let prevPoint = {
    x: position.x + size * cos(angleOffset),
    y: position.y + size * sin(angleOffset)
  };
  for (let i = 1; i < n; i++) {
    let currPoint = {
      x: position.x + size * cos(angle * i + angleOffset),
      y: position.y + size * sin(angle * i + angleOffset)
    };
    line(prevPoint.x, prevPoint.y, currPoint.x, currPoint.y);
    prevPoint = currPoint;
  }
  line(prevPoint.x, prevPoint.y, position.x + size * cos(angleOffset), position.y + size * sin(angleOffset));
}
You can use this function by calling it in the draw function and passing in the desired number of sides, position, and size. The angle offset will be automatically calculated based on the number of sides. For example:
function draw() {
  background(220);
  drawRegularPolygon(3, {x: 100, y: 100}, 50);
}
This will draw an equilateral triangle with its center at (100, 100) and a size of 50 pixels, with one side of the triangle parallel to the horizon.
PROMPT: Ok, I tried that result and it only works when n is odd. What should the angleOffset be when n is even?
ChatGPT Response:
If n is even, you can use the following formula for the angleOffset:
angleOffset = PI / 2 - TWO_PI / n + PI / n;This will rotate the polygon so that one of its sides is parallel to the horizon. Here's the revised drawRegularPolygon function with the angleOffset formula included:
function drawRegularPolygon(n, position, size) {
  let angle = TWO_PI / n;
  let angleOffset;
  if (n % 2 == 0) {
    angleOffset = PI / 2 - TWO_PI / n + PI / n;
  } else {
    angleOffset = PI / 2 - TWO_PI / n;
  }
  let prevPoint = {
    x: position.x + size * cos(angleOffset),
    y: position.y + size * sin(angleOffset)
  };
  for (let i = 1; i < n; i++) {
    let currPoint = {
      x: position.x + size * cos(angle * i + angleOffset),
      y: position.y + size * sin(angle * i + angleOffset)
    };
    line(prevPoint.x, prevPoint.y, currPoint.x, currPoint.y);
    prevPoint = currPoint;
  }
  line(prevPoint.x, prevPoint.y, position.x + size * cos(angleOffset), position.y + size * sin(angleOffset));
}
You can use this function by calling it in the draw function and passing in the desired number of sides, position, and size. The angle offset will be automatically calculated based on the number of sides. For example:
function draw() {
  background(220);
  drawRegularPolygon(4, {x: 100, y: 100}, 50);
}
This will draw a square with its center at (100, 100) and a size of 50 pixels, with one side of the square parallel to the horizon.